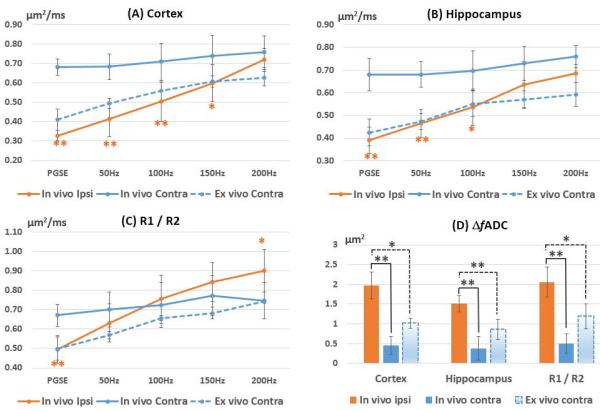
Fig. 4.
Changes in ADC with frequency in the cortex, hippocampus, and the joint regions of the R1 and R2 (R1/R2). The ΔfADC values in the edema regions were significantly higher than both in vivo and ex vivo ΔfADC values measured in the contralateral regions. Error bars indicate the inter-subject standard deviation. The ex vivo ADC values from the ipsilateral side were not included due to large variations (supplemental table 1). * and ** denote that a two-tailed t-test between the ipsilateral and contralateral measurements produced a p-value less than 0.01 and 0.001, respectively.

