Figure 1.

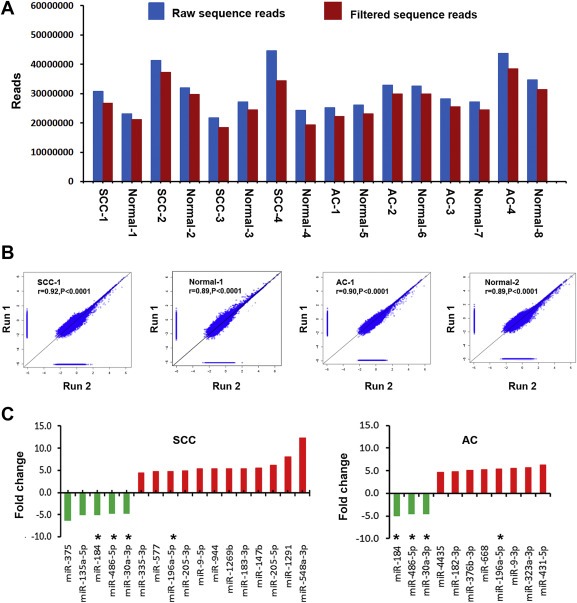
Global deep sequencing analysis of miRNAs in non‐small cell lung cancer (NSCLC) tissue and normal lung tissue specimens. A, an average of 29,485,315 raw sequence reads (blue bars) per specimen were identified by Illumina high‐throughput sequencing. From the raw reads, an average of 26,070,789 filtered sequence reads (red bars) were obtained per specimen. B, expression of miRNAs measured by deep sequencing across duplicates (run 1 and run 2) for squamous cell carcinomas (SCCs) and adenocarcinomas (ACs) and their matched normal lung tissues. A close correlation was found from two different experiments (run 1 and run 2) on the same samples (r values ranged from 0.89 to 0.92, all p < 0.0001). The figure only shows results from one SCC and one AC and their paired normal lung tissues. C, twenty‐four differentially expressed miRNAs with ≥ 4.5 fold changes in NSCLC vs. normal tissues. Up‐regulated miRNAs (red bars) are shown above the x‐axis, whereas down‐regulated miRNAs (green bars) below the x‐axis. Left, 17 miRNAs with dysregulation in stage I SCC tissues. Right, 11 miRNAs had dysregulation in stage I AC tissues. *, four miRNAs (miRs‐196a‐5p, 30a‐3p, 486‐5p, and 184) displayed altered expressions in both SCC and AC. Therefore, there are a total of 24 miRNAs showing dysregulation in the NSCLC specimens. More information about changes of the miRNAs can be found in Table 1
