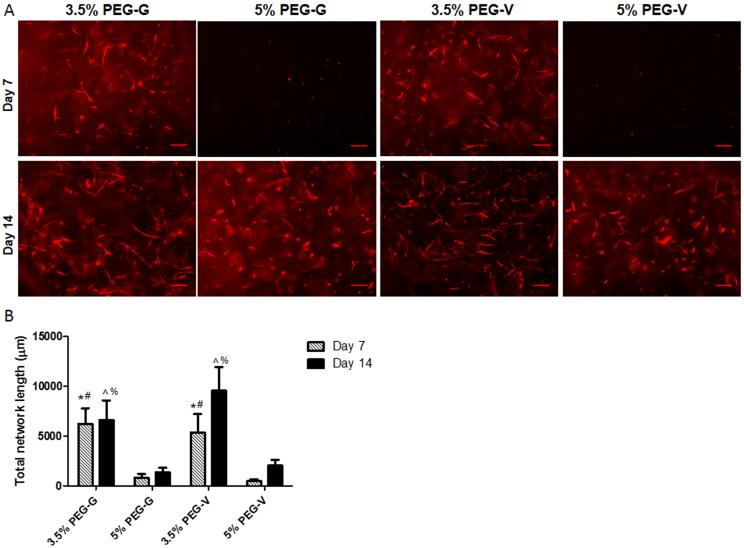
Figure 3.
Vasculogenesis in vitro was monitored in PEG hydrogels of different w/v% and cross-linked with either of two degradable peptides. (A) mCherry tagged ECs co-encapsulated with unlabeled fibroblasts organized into vascular networks in gels, and were imaged after 7 or 14 days (scale bars = 200 μm). (B) Quantification of the total lengths of the vessel networks showed that the extent of vascularization was significantly higher in lower w/v% gels and slightly increased at later time points in PEG-V gels. Significant differences were found via 1-way ANOVA followed by Bonferroni post-tests and are indicated according to the following symbols: * compared to 5% PEG-G at 7 days, # compared to 5% PEG-V at 7 days, ^ compared to 5% PEG-G at 14 days, and % compared to 5% PEG-V at 14 days, p < 0.05.

