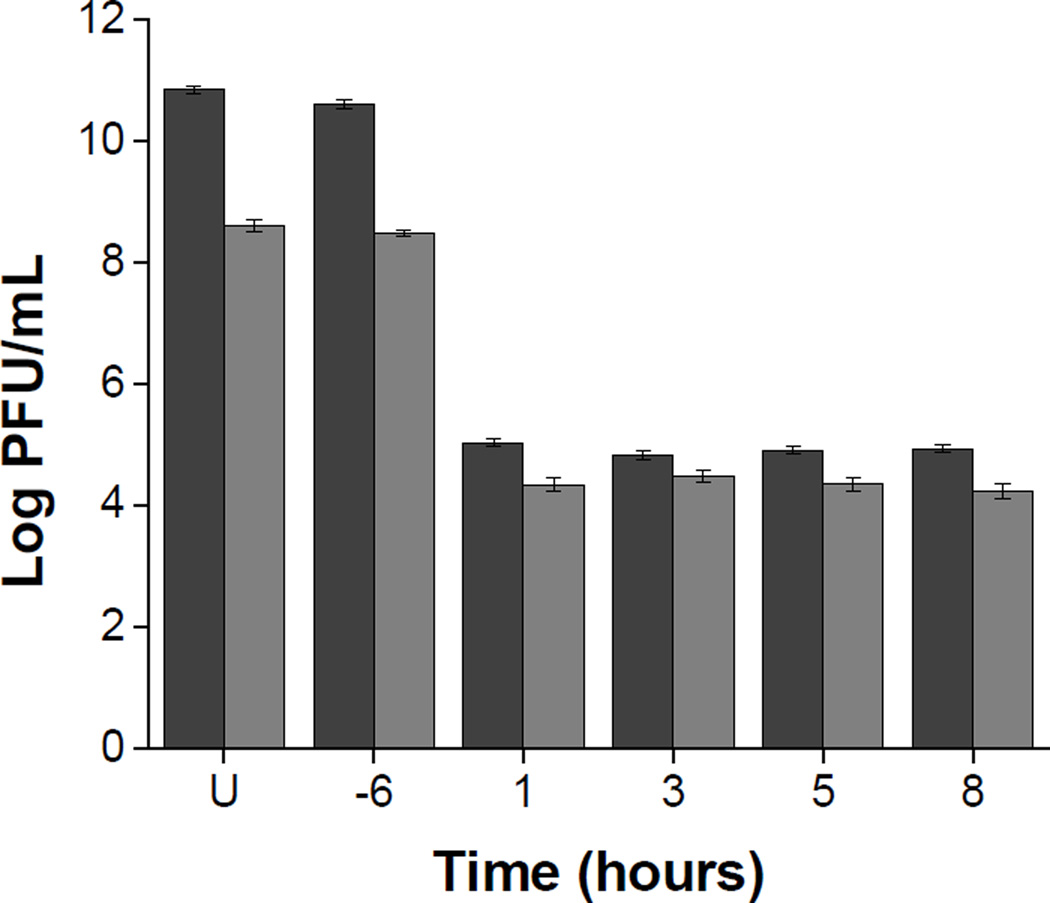
Figure 3. Effect of time of addition of subtilosin on HSV-2 production.
Vero cells were treated with subtilosin during 6 h previous to infection (−6) or were incubated with subtilosin from different times after infection (1, 3, 5 or 8 h p.i.). At 24 h p.i. extracellular (grey bars) and total virus (black bars) production were determined. U = untreated infected culture. Data are mean values of virus titers from duplicate determinations ± 95% CI.

