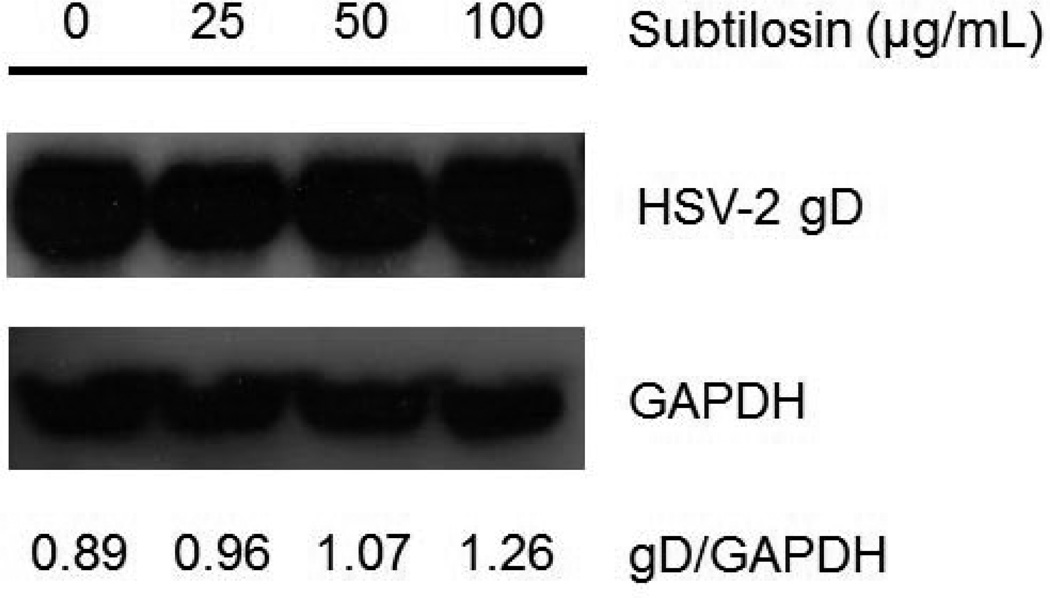
Figure 5. gD production in subtilosin treated cells.
HSV-2 infected Vero cells were treated with different concentrations of subtilosin and at 24 h p.i. the expression of viral protein gD and cellular protein GAPDH, used as loading control, was assessed by Western blot. The relative intensity of gD band with respect to GAPDH band for each sample of one representative experiment is shown.

