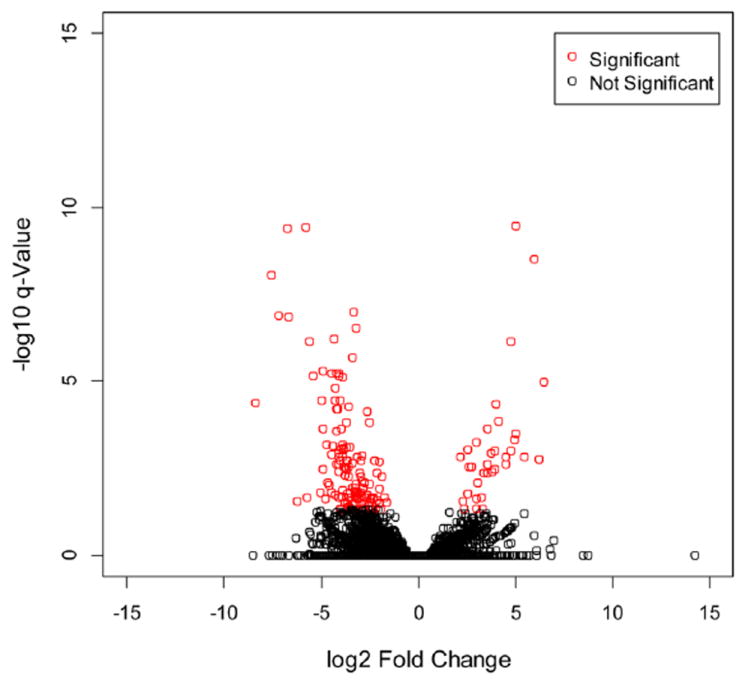
Figure 2.

Volcano plot of differentially expressed transcripts by rapamycin. The 183 significantly differentially expressed protein-coding transcripts (represented in red), as determined by Cuffdiff default settings with normalization. X-axis values are log2 (fold change) and y-axis values are the −log10 of q-value. q-values indicate FDR-adjusted p-value for multiple-testing.
