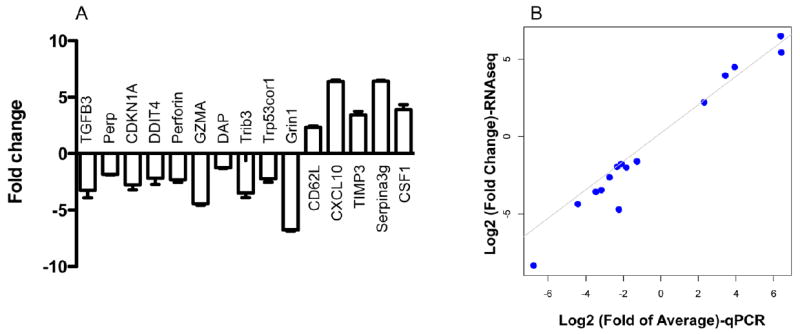
Figure 5.

Validation of RNA-Seq data using quantitative RT-PCR. (A) qRT-PCR analysis of 10 selected downregulated genes and 5 upregulated genes. Fold change (y-axis) were generated by comparing rapamycin treated sample to control. The data represent mean of three individual samples plus SEM. The experiment was repeated twice with similar results. (B) The Log2 Fold of Average qRT-PCR (x-axis) were plotted against Log2 Fold Change values of RNA sequencing(y-axis), (Pearson correlation values >0.92)
