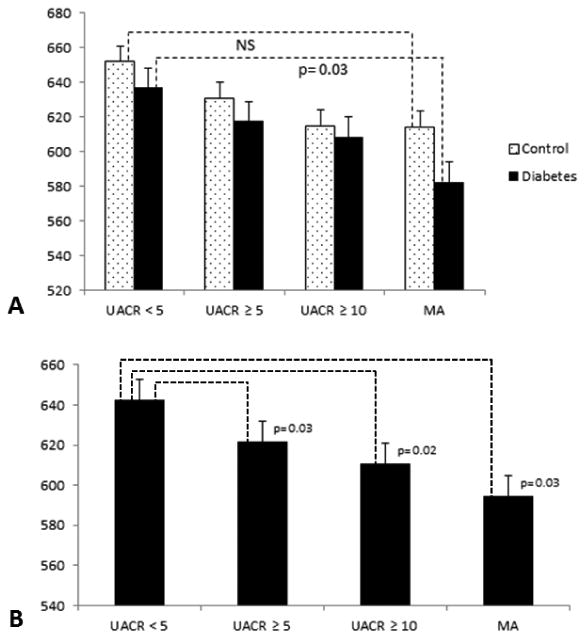
Figure 2.

A. Mean global gray matter (GM) volume for each urine albumin-to-creatinine ratio (UACR [mg/dl]) subgroup for the diabetes (dotted bars) and the control (black bars) groups. GM volume was lower in the diabetic participants with MA as compared to diabetic participants with UACR<5 [mg/dl]. B. For the entire cohort, GM volume was lower for participants with UACR ≥5 (p=0.03), UACR >10 (p=0.02) and MA (p=0.03) as compared to participants with an UACR closer to normal.NJ
