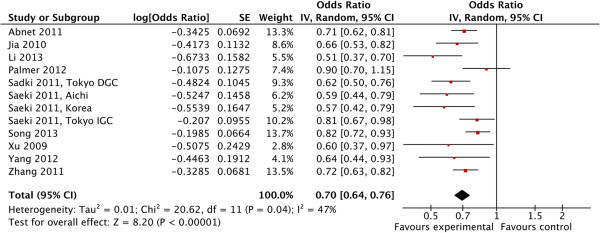
Figure 2.

Forest plot describing MUC1 rs 4072037 and susceptibility to gastric cancer under the allele model. The horizontal lines represent 95% CIs for estimating the outcome of the G allele versus the A allele in the meta-analysis. (■) Overall estimates of the effects. CI, confidence interval; OR, odds ratio.
