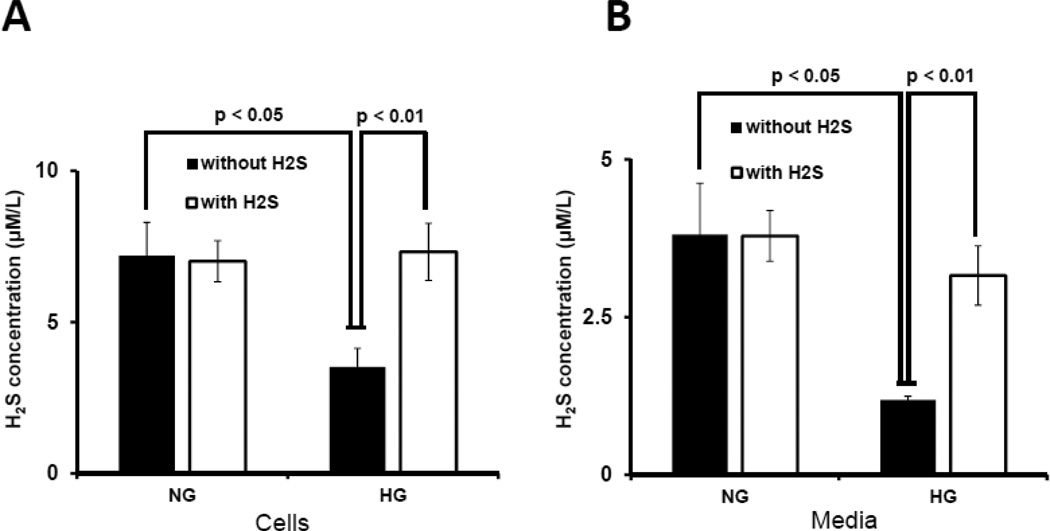
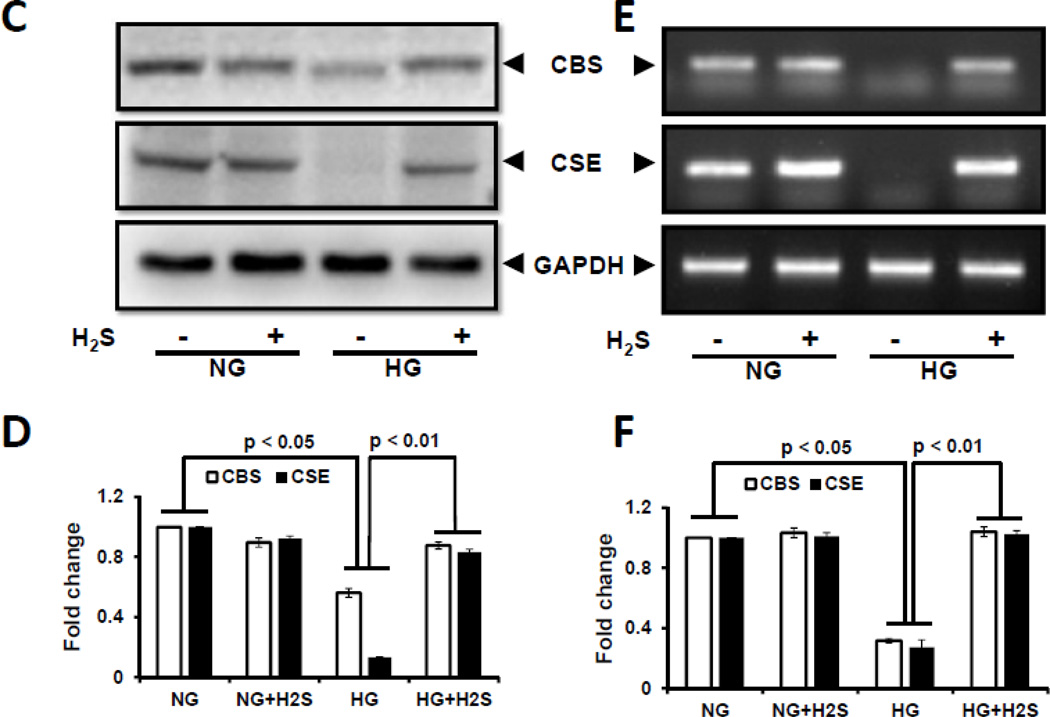
Figure 1. Hyperglycemia attenuated H2S production, and CBS and CSE expression.
Mouse glomerular endothelial cells (MGECs) were cultured in normoglycemic (NG) and hyperglycemic (HG) conditions without or with H2S (30 µM) for 24 h. (A–B) H2S concentration in cell lysates and media. H2S measurement in the media was performed within 2 h of sample collection. (C) 100 µg of protein was loaded for Western blot and GAPDH was used as a loading control. (D) Pixel densities were quantified as fold change. (E) RT-PCR amplification and transcript levels of CBS and CSE were measured using 2 µg of RNA extracted from MGECs as described in Materials and Methods. GAPDH mRNA was used as loading control. (F) Pixel densities are presented as fold change. Data represents mean ± s.e.m. (n = 5). Images are representative of four independent experiments performed in triplicate for H2S.


