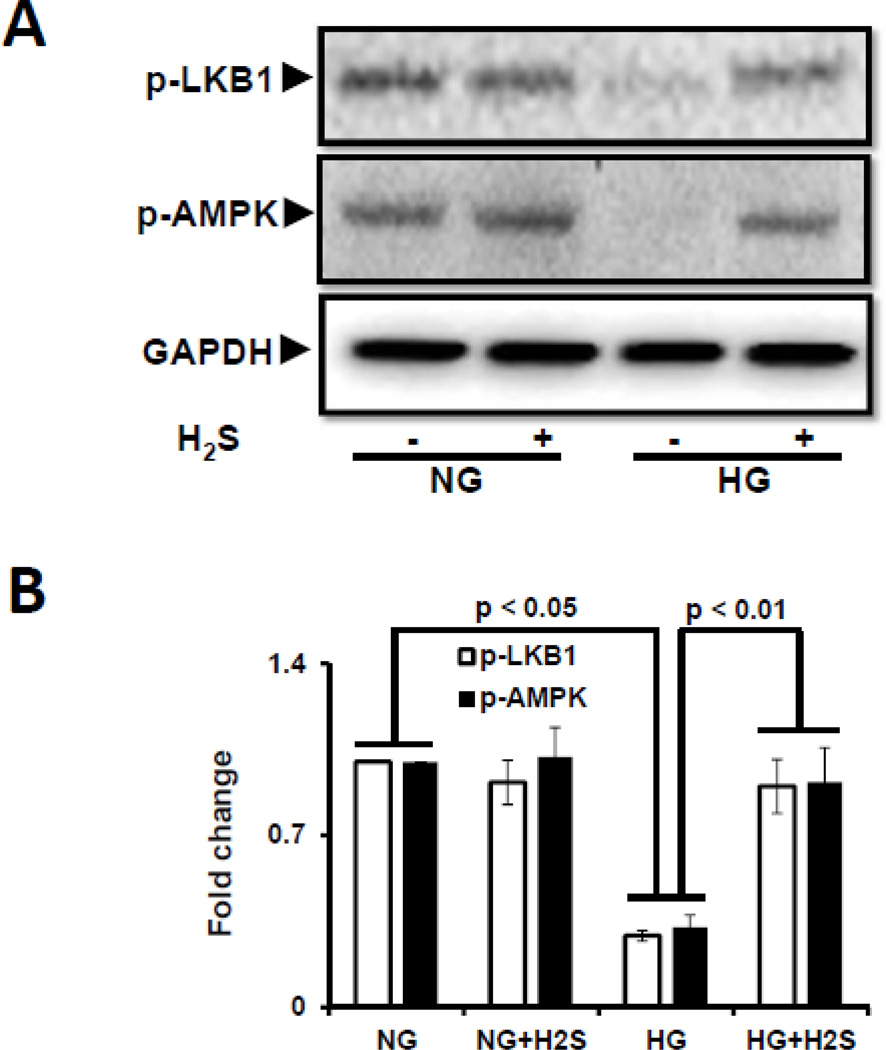
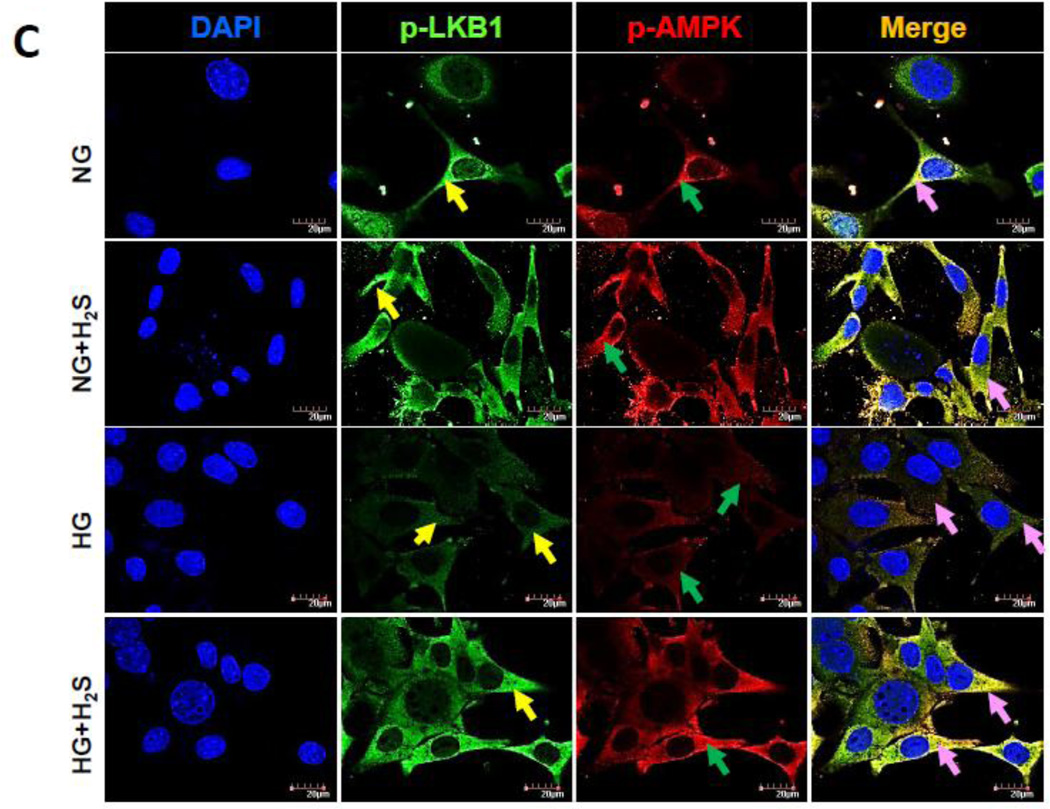
Figure 4. H2S treatment in hyperglycemia normalized LKB1 and AMPK phosphorylation.
(A) Phospho-LKB1 and phospho-AMPK were measured by Western blot using GAPDH as control. (B) Protein expression as fold change. (C) MGECs were cultured in NG and HG condition in 8-well chamber slide, and treated without or with H2S for 24 h. Cells were immunostained with phospho-LKB1 and phospho-AMPK antibodies to detect kinase activation. Yellow, green and pink arrows represent p-LKB1, p-AMPK, and co-localization of p-LKB1 and p-AMPK, respectively. Images are representative of single experiment and bar graphs represent mean ± s.e.m. from five independent experiments (n = 5).


