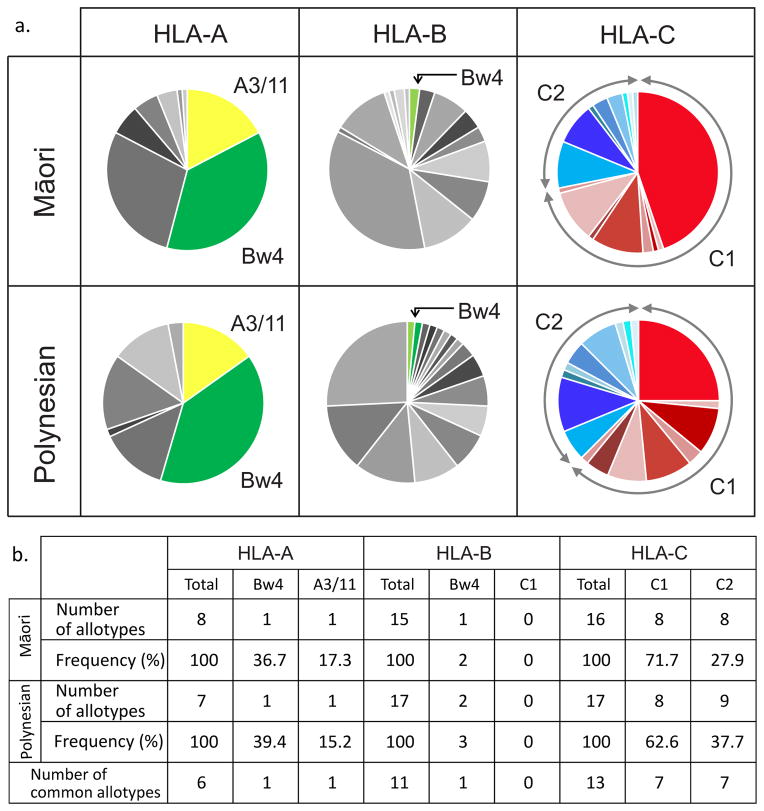
Figure 1. Māori and Polynesian KIR ligands are provided by HLA-A and HLA-C but not by HLA-B.
a. The allele-frequency spectra of HLA class I. Each segment of the pie corresponds to a distinct allotype, which are matched in shade between the two populations: (yellow) – allotype has A3/11 epitope, (green) – Bw4 epitope, (red) – C1 epitope, (blue) – C2 epitope, (gray) indicates the allotype does not carry a KIR ligand. The allele names and frequencies are given in Supplementary Figure 1 and (Edinur et al. 2013).
b. The number of HLA-A, -B or -C allotypes present within each category of KIR ligand, and their frequencies in the Māori and Polynesian populations.

