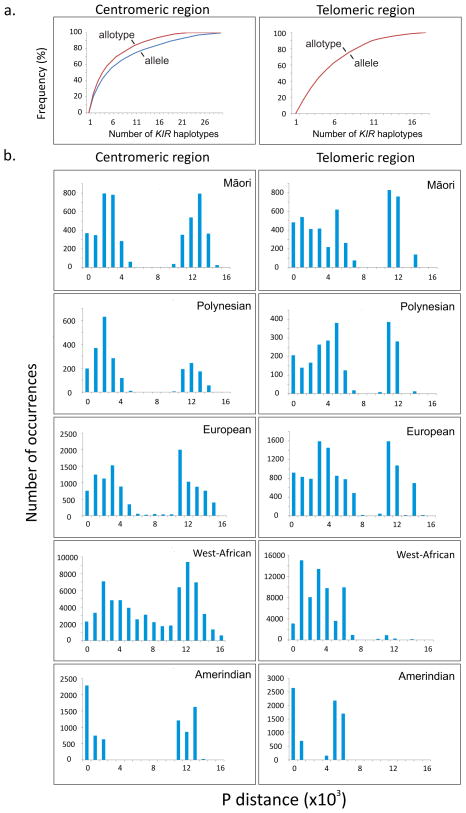
Figure 5. Bimodal KIR diversity in centromeric and telomeric regions of Māori and Polynesian KIR haplotypes.
a. Cumulative frequency plots of KIR/KIR haplotype frequencies. (red) indicates allele-level haplotypes (blue) represent allotype-level haplotypes (i.e. considering only substitutions that alter the sequence or number of expressed KIR); the telomeric region the plots are identical.
b. Shows histograms of mismatch distributions of centromeric (left) and telomeric region (right) haplotypes determined by percentage difference (p-distance).

