
Figure 1. Upregulation of TIPE3 expression correlates with tumorigenesis.
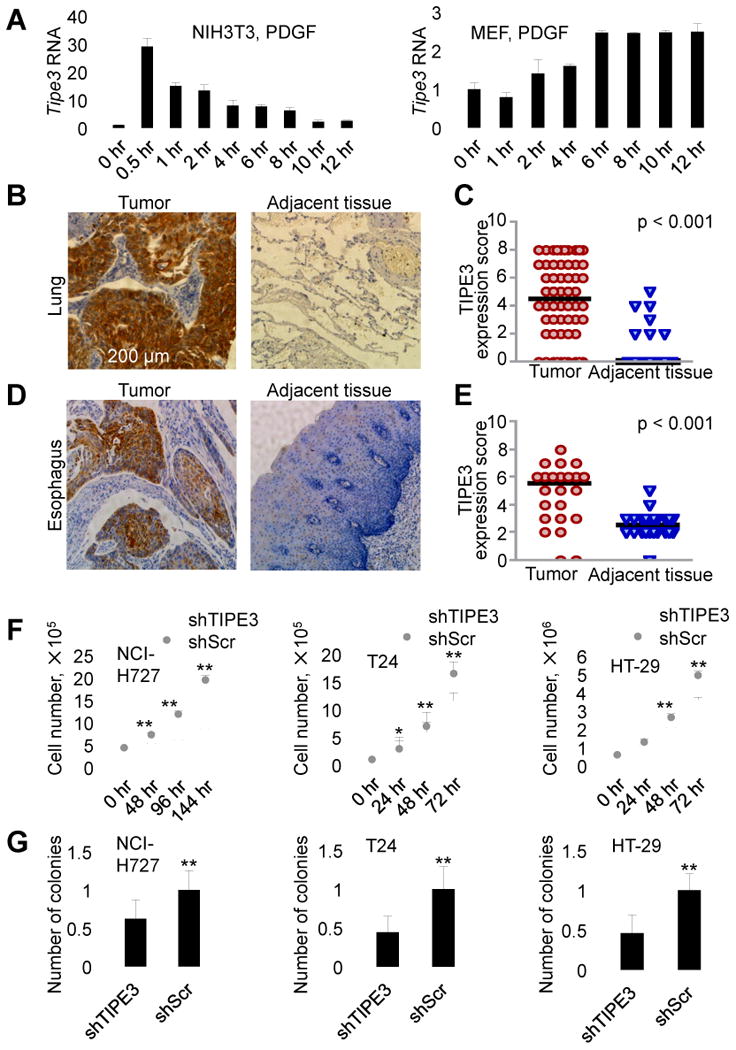
(A) RT-PCR analyses of TIPE3 mRNA levels in the NIH3T3 fibroblast cell line (left panel) and C57BL/6 murine embryonic fibroblasts (MEF, right panel). Cells were first serum-starved for 12 hr and then stimulated with 20 (left panel) and 50 (right panel) ng/ml of PDGF for the indicated times before being collected for the RNA analyses. The expression levels of TIPE3 in NIH3T3 (right panel) and MEF (left panel) at 0 hr were set as 1. (B-E) TIPE3 upregulation in human cancers. Immunohistochemistry analyses of TIPE3 protein expression in tumors and their adjacent normal tissues from patients diagnosed with lung cancer (B and C) and esophageal cancer (D and E). TIPE3-positive cells are shown in brown (B and D). Quantitation of the TIPE3 expression in tumors and adjacent tissues of 60 patients with lung cancer (C) and 24 patients with esophageal cancer (E) was performed as described in Supplemental Experimental Procedures. Each data point represents a TIPE3 expression score of patients. The horizontal bars represent the medians. (F) Cell growth analysis of human NCI-H727, T24, and HT-29 cells stably expressing either shTIPE3 or short hairpin scrambled (shScr) RNA (control) over the indicated times. (G) Soft agar colony formation of NCI-H727, T24, and HT-29 cells expressing either shTIPE3 or shScr. Numbers of colonies formed by cells expressing shScr were set as 1. For (A), (F), and (G), values represent means ± SD, * p < 0.05, and ** p < 0.01; h denotes hr. The experiments were repeated at least three times with similar results. See also Figure S1.