
Figure 2. TIPE3 promotes tumorigenesis, cell growth, and cell survival in vitro and in vivo.
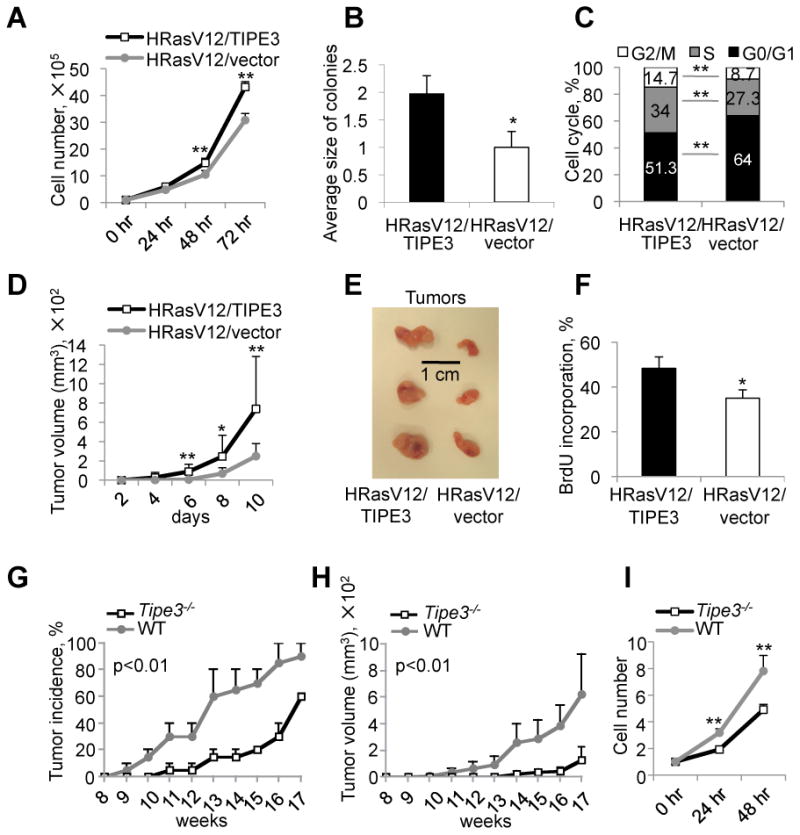
(A-C) Analyses of cell growth (A), relative colony size in soft agar (B), and cell cycle progression (C) of NIH3T3-HRasV12 cells stably transfected with either TIPE3-Flag or empty vector. For (B), number of colonies formed by NIH3T3-HRasV12 cells transfected with empty vector was set as 1. The experiments were repeated at least three times with similar results. Values represent means ± SD. (D-F) TIPE3 promotes tumor growth in a murine xenograft model. Nude mice (n=14) were injected subcutaneously with NIH3T3-HRasV12 cells stably transfected with either TIPE3-Flag or empty vector. Tumor volume was determined over a course of 10 days (D). At day 10, tumors were excised and photographed (E). In vivo cell proliferation was analyzed by BrdU incorporation. The percentages of BrdU-positive cells in tumor sections are shown (F). Results are representative of two independent experiments. Values represent means ± SD. (G-I) Tipe3 deficiency reduces tumor growth in mice. Tipe3-/- mice and wild-type (WT) controls (n=15), 7 weeks of age, were injected subcutaneously with 3-methylcholanthrene. Tumor incidence was examined for up to 17 weeks (G). Data are pooled from two independent experiments. Tumor volume was monitored for up to 17 weeks (H). Results are representative of two independent experiments. Values represent means ± SEM; the p values shown are for differences after week 11. Growth of Tipe3-/- and wild-type fibrosarcoma cells over the indicated times (I). Data are pooled from three independent Tipe3-/- and two independent wild-type fibrosarcoma cell cultures established from different 3-methylcholanthrene-induced tumors. The cell numbers at 0 hr was set as 1. The experiments were repeated four times with similar results. Values represent means ± SD. For all panels, * p<0.05, and ** p<0.01; h denotes hr, d denotes days. See also Figure S2.