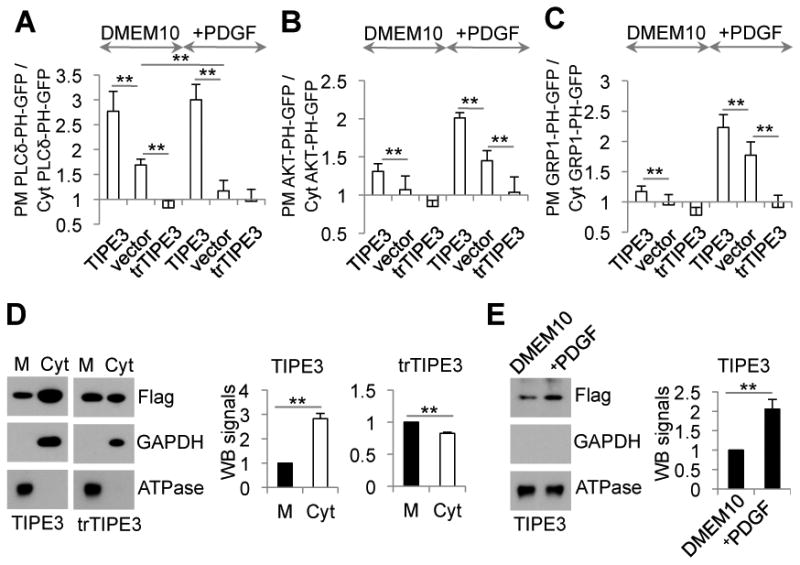
Figure 5. TIPE3 regulates lipid metabolism and signaling.

(A-C) NIH3T3 cells were co-transfected with (A) PLCδ-PH-GFP, (B) AKT-PH-GFP, or (C) GRP1-PH-GFP and one of the following plasmids as indicated: pRK5 vector (vector), pRK5-TIPE3-Flag (TIPE3), and pRK5-trTIPE3-Flag (trTIPE3). Thirty-two hr after the transfection, cells were cultured in DMEM with 10% FCS (DMEM10, A-C), or in DMEM10 with 40 ng/ml of PDGF for 5.5 min (+PDGF, A), or serum-starved for 4 hr and then cultured in DMEM containing 40 ng/ml of PDGF for 7.5 min (+PDGF, B and C) followed by fixation. Cells expressing the Flag-tagged proteins were selected by immunofluorescence microscopy with an anti-Flag antibody. Ratios of GFP fluorescence intensity on plasma membrane (PM) over that in the cytoplasm (Cyt) of the same cells are calculated based on line fluorescence intensity profiles. (D) Membrane (M) and cytoplasmic (Cyt) proteins fractions were prepared from NIH3T3 cells stably transfected with TIPE3-Flag and trTIPE3-Flag. Western blot was performed using antibodies against the indicated proteins. Signals of TIPE3 or trTIPE3 in membrane fractions were set as 1. (E) NIH3T3 cells stably transfected with TIPE3-Flag were cultured in DMEM with 10% of FCS (DMEM10) or serum-starved for 4 hr and then cultured in DMEM containing 40 ng/ml of PDGF for 7.5 min (+PDGF). Membrane protein fractions (M) of these cells were analyzed by Western blot using antibodies against the indicated proteins. Signals of TIPE3 in membrane fractions of cells cultured in DMEM10 were set as 1. For (A-E), values represent means ± SD; **p<0.01. The experiments were repeated at least three times with similar results. See also Figure S5.
