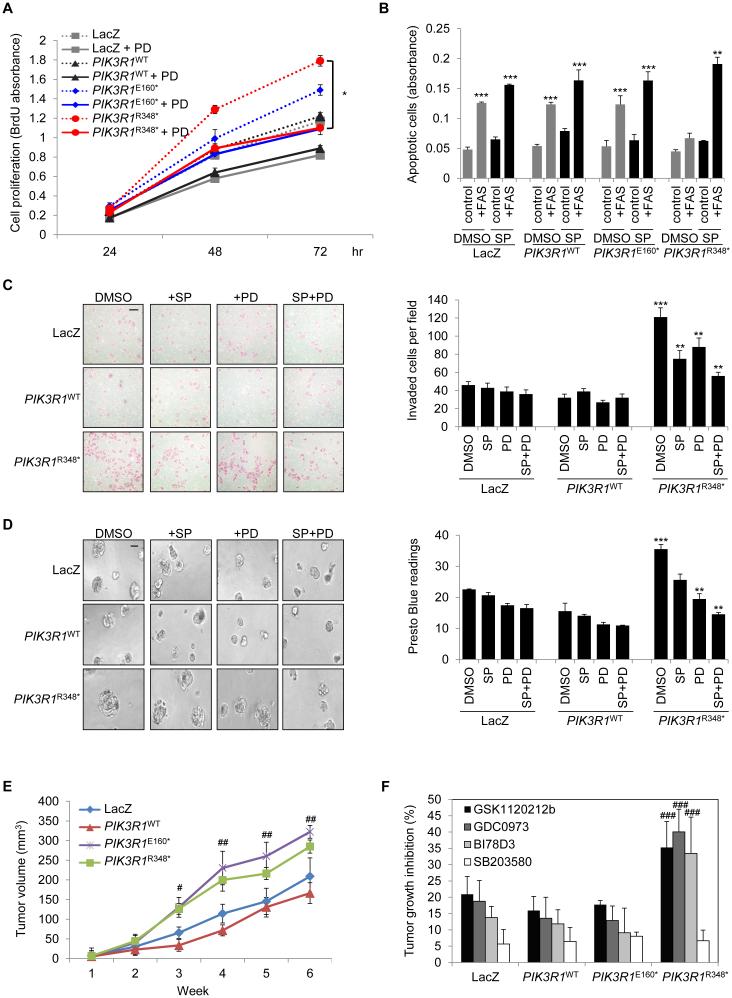
Figure 7. PIK3R1R348* promotes malignant phenotypes in vitro and in vivo through ERK and JNK.
(A) SKUT2 stably expressing LacZ, PIK3R1WT, PIK3R1E160* or PIK3R1R348* were cultured in medium containing 1% FBS with or without MEK inhibitor PD0325901 (PD) at 20 nM. DMSO served as negative control. Cell proliferation was determined at 24, 48, and 72 hr after seeding. (B) Stable SKUT2 were cultured in medium containing 5% FBS (control) or anti-Fas antibody (+FAS) with or without JNK inhibitor SP600125 (SP) at 20 μM for 72 hr before apoptosis assay. (C) Representative images (left) and mean number of invaded cells of five fields at magnification of 40x (right) of indicated SKUT2 cells in the presence of indicated inhibitors. (D) Representative images (left) and cell viability (right) of indicated SKUT2 cells grown in 3D culture for 6 days before being treated with SP or PD or combination for another 3 days. (E) Cells were subcutaneously injected into mouse flank regions (n=12/group). Tumor volume was measured weekly. (F) Tumor-bearing mice were treated with vehicles, MEK inhibitor GSK1120212b or GDC0973, JNK inhibitor BI78D3 or p38 MAPK inhibitor SB203580. Tumor growth inhibition percentages were calculated and presented in the graph. Scale bars represent 50 μm (C and D). All in vitro assays were performed with two independent stable clones yielding similar results. Data (Means (±SD)) of clone #1 of triplicates from 3 independent experiments are shown. All in vivo data are represented as mean ± SEM. *p < 0.05; **p < 0.05 compared with PIK3R1R348* DMSO control; ***p < 0.05 compared with PIK3R1WT DMSO control. #p < 0.05 compared with PIK3R1WT at same time point; ##p < 0.01 compared with PIK3R1WT at same time point. ###p < 0.05 compared with PIK3R1WT treated with corresponding inhibitor. See also Figure S7.

