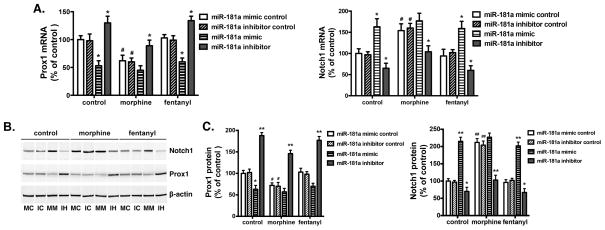
Figure 4. Prox1 and Notch1 expression change correspondingly with miR-181a expression.
Mouse NPC primary cultures were transfected with miR-181a mimic control (double strand), miR-181a inhibitor control (single strand), miR-181a mimic, or miR-181a inhibitor by using Lipofectamine 2000. Two days after transfection, the mRNA (A) and protein (B–C) levels of Prox1 and Notch1 were determined by real-time PCR and western blot, respectively. The results were normalized against internal controls (GAPDH for mRNA and β-actin for protein). MC: miR-181a mimic control; IC: miR-181a inhibitor control; MM: miR-181a mimic; IH: miR-181a inhibitor. *, p<0.05, **, p<0.01 compared to cultures transfected with control RNA and with the same drug treatment. #, p<0.05, ##, p<0.01 compared to cultures transfected with control RNA without drug treatment. All data represent mean ± SEM of four independent experiments.

