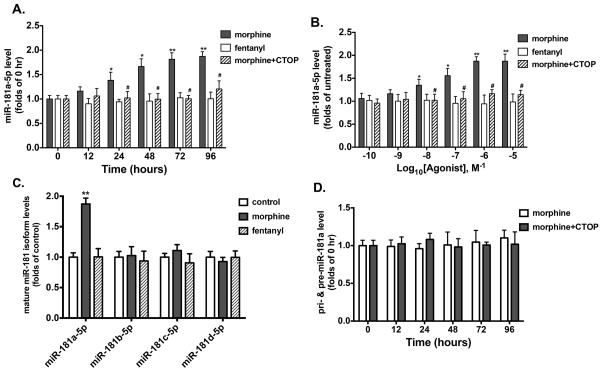
Figure 6. Morphine increases the expression of miR-181a via OPRM1.
(A) Time-dependent abilities of morphine and fentanyl to modulate the expression of miR-181a-5p in mouse NPCs cultured in complete differentiation medium. Cultures were treated with 1 μM morphine or 10 nM fentanyl for indicated times with or without the treatment of 10 μM CTOP. The expression of miR-181a-5p was determined by real-time PCR and normalized against the mRNA level of GAPDH. The normalized results were further normalized against the results in untreated cultures (0 h). *, p<0.05, **, p<0.01 compared to untreated cultures in the absence of CTOP. #, p<0.05 compared to the morphine-treated group with the same time point or dose, but without CTOP treatment.
(B) Dose-dependent curves of morphine and fentanyl to modulate the expression of miR-181a-5p in mouse NPCs cultured in complete differentiation medium. Cultures were treated with indicated doses of agonists for 96 h with or without the treatment of 10 μM CTOP. The expression of miR-181a-5p was determined by qRT-PCR. *, p<0.05, **, p<0.01 compared to untreated cultures in the absence of CTOP. #, p<0.05 compared to the morphine-treated group with the same time point or dose, but without CTOP treatment.
(C) The abilities of morphine and fentanyl to modulate the expression of the four isoforms of miR-181 in mouse NPCs cultured in complete differentiation medium. Cultures were treated with 1 μM morphine or 10 nM fentanyl for 96 h. The expression of miR-181a-5p was determined by qRT-PCR. **, p<0.01 compared to control.
(D) Time-dependent abilities of morphine to modulate the expression of pri- and pre-miR-181a in mouse NPCs cultured in complete differentiation medium. Cultures were treated with 1 μM morphine for indicated times with or without the treatment of 10 μM CTOP. The expression of pri- and pre-miR-181a was determined by qRT-PCR. All data represent mean ± SEM of four independent experiments.

