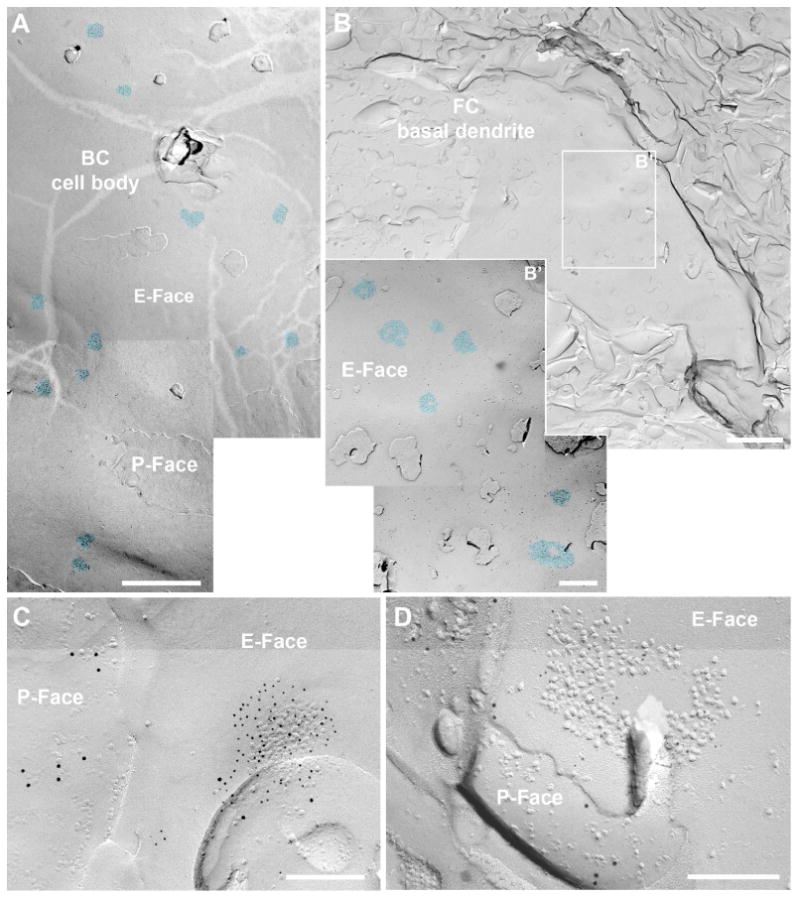
Figure 2. Auditory nerve synapses in the FRIL replica.

A-B. FRIL electromicrographs at low magnification showing the IMP-cluster distribution of auditory nerve synapses (AN) on bushy cell soma (A) and on basal dendrites of fusiform cells (B). B' shows higher magnification of the boxed area in B. The IMP-clusters are pseudocolored in blue to aid visualization. C-D. Images of PSDs of AN synapses on the cell body of a BC (C) and on a basal dendrite of a FC (D) immunolabeled with N-terminus antibodies for pan-AMPAR (GluA1-4) antibody (5 nm gold; C) or GluN1 (5 nm gold; D), indicating the presence of IMP-clusters on the E-face, accompanied by a presynaptic protoplasmic face (P-face) that was labeled by vGluT1 immunoparticles (vesicular glutamate transporter 1; 10 nm gold) as a marker for AN endings. Scale bars: A: 1 μm, B: 2 μm, B': 500 nm, C-D: 200 nm.
