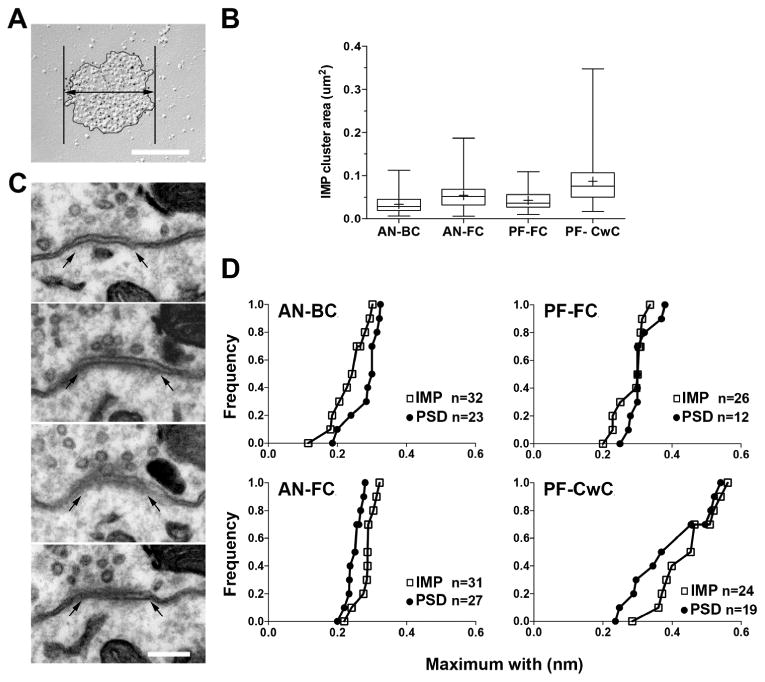
Figure 4. Mean synaptic size in AN and PF synapses.

A. FRIL image of the IMP-clusters of AN-BC synapses. The thick line with a double arrow indicates the maximum width of an IMP-cluster. B. Whisker-box histogram showing the distribution of the IMP-cluster area for AN and PF synapses. Horizontal bars show the median, boxes indicate the 25-75 percentiles, and whiskers indicate the minimum and maximum. Crosses indicate the mean. C. Serial ultrathin sections of an AN-BC synapse. Arrows indicate the edge of the PSD. D. Cumulative frequency plots of the maximum widths of the PSDs and IMP-clusters. The maximum widths of the PSD and IMP-clusters were not significantly different (AN-BC: p = 0.70, AN-FC: p = 0.33, PF-FC p = 0.06, PF-CwC p = 0.30, Mann–Whitney U test). Scale bar in A and C: 200 nm.
