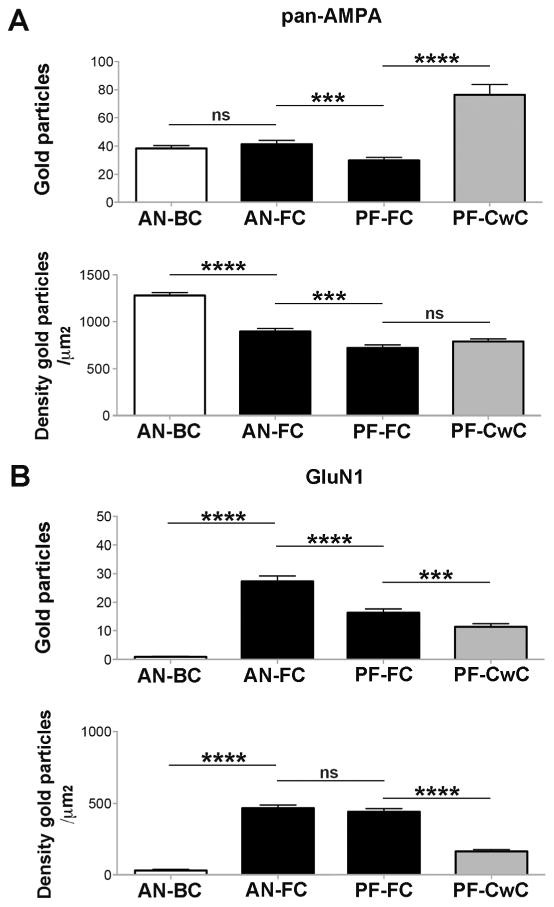
Figure 7. Number and density of AMPARs and NMDARs in IMP-clusters of AN and PF synapses.

A-B. Histograms show the density and number of gold particles per IMP-cluster for AMPAR (A) and GluN1 (B) at AN-BC and AN-FC synapses and PF-FC and PF-CwC synapses. The number of AMPAR gold particles was similar for AN-BC and AN-FC synapses, although the density was higher for AN-BC synapses. For PF-FC and PF-CwC synapses, the density of AMPAR gold particles was similar, although the number of gold particles was higher for PF-CwC synapses. The number and density of gold particles for AMPARs was higher in AN synapses on the basal dendrites of FCs than in PF synapses on the apical dendrites of FCs. B) GluN1 labeling was stronger at the IMP-clusters of AN-FC synapses, while it was almost undetectable at the IMP-clusters of AN-BC synapses. GluN1 labeling was stronger at IMP-clusters of PF-FC synapses compared to those of PF-CwC synapses. GluN1 expression was higher in AN synapses on the basal dendrites of FCs than in PF synapses on the apical dendrites of FCs (Mann-Whitney U test (p < 0.001).
