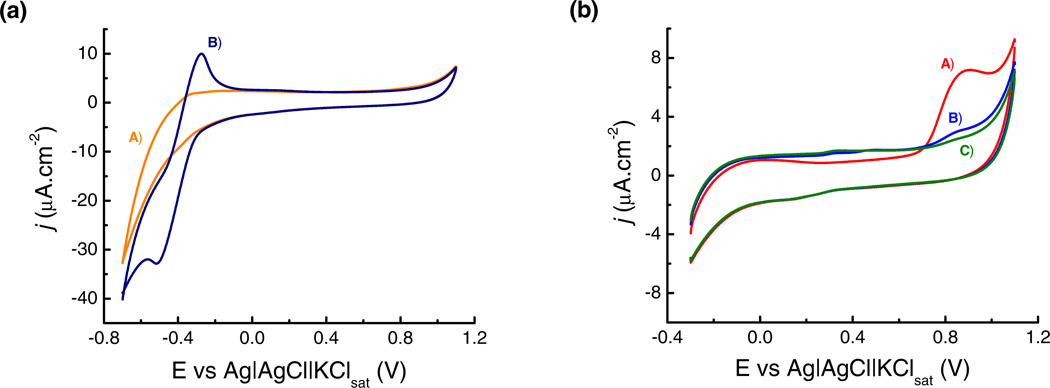
Figure 2.
(a) Cyclic voltammograms of OTCE performed in: A) 10 mmol·L−1 citrate buffer at pH = 4.2; and B) 0.1 mmol·L−1 FAD dissolved in 10 mmol·L−1 citrate buffer at pH = 4.2. (b) Cyclic voltammograms of GOx/OTCE substrate after adsorption of GOx at +500 mV. All voltammograms were obtained in 10 mmol·L−1 citrate buffer at pH = 4.2 and correspond to: A) 1st cycle; B) 2nd cycle; and C) 3rd cycle. Scan rate: 50 mV·s−1.

