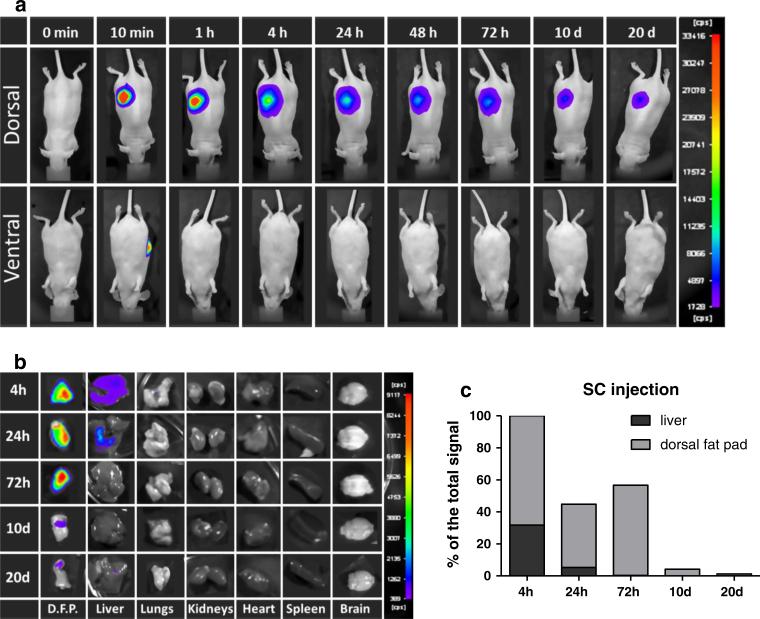
Fig. 5.
Biodistribution of FAPolAF647 following subcutaneous injection. a Time-series images of a representative animal before and after subcutaneous injection of 10 μg FAPolAF647. Upper row dorsal view, lower row ventral view. b Time-series images of organs collected at different time-points. c Quantitation of fluorescent signals measured in organs over time

