
Figure 1.
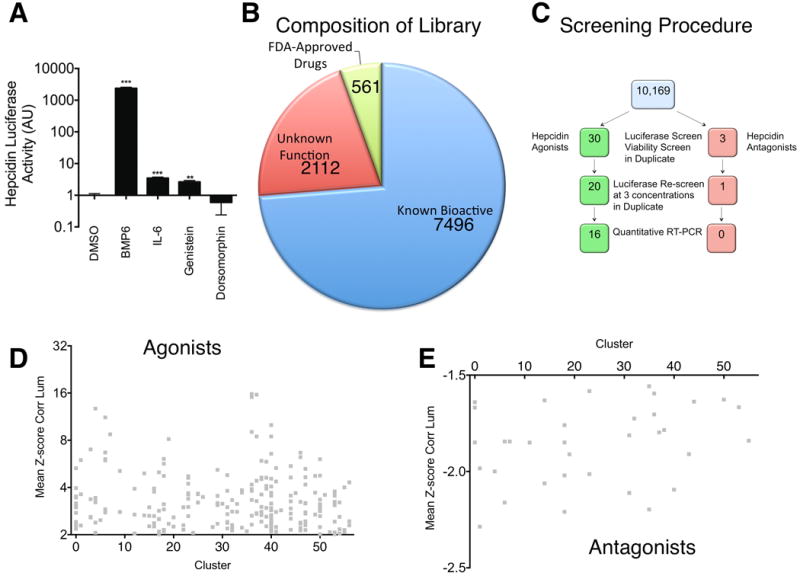
A. Effect of positive and negative controls on Hepcidin-luciferase activity in stably transfected HepG2 cells. After 16 hours of serum starvation in α-MEM/0% FBS, HepG2 cells stably transfected with Hepcidin-luciferase were treated for 24 hours with DMSO 1%, BMP6 50 ng/ml, IL-6 100 ng/ml, Genistein 10 μM, or Dorsomorphin 40 μM. Hepcidin-luciferase activity was measured using the OneGlo Assay (Promega) and is shown as mean fold-change over DMSO-treated control. The global P-value generated using the Kruskal-Wallis test was <0.0001. Unpaired Student's t-tests were performed compared to DMSO alone. ***denotes 0.0001≤P<0.0009 and **denotes 0.0009≤P<0.009. N=3 biological replicates per condition. B. Library Composition. The screening library included known bioactive molecules, molecules of unknown function, and FDA-approved drugs. C. Screening Method. 10,169 chemicals were evaluated for Hepcidin-luciferase activity and viability in HepG2 cells stably transfected with a Hepcidin-luciferase promoter construct. The hits were then re-evaluated in the same assay at three concentrations and in a quantitative realtime RT-PCR assay. D,E. Scatter-plot of structural cluster vs. mean z-score for Hepcidin-luciferase activity for 343 molecules found to increase (D) or 62 molecules found to decrease (E) Hepcidin-luciferase activity.