
Figure 2.
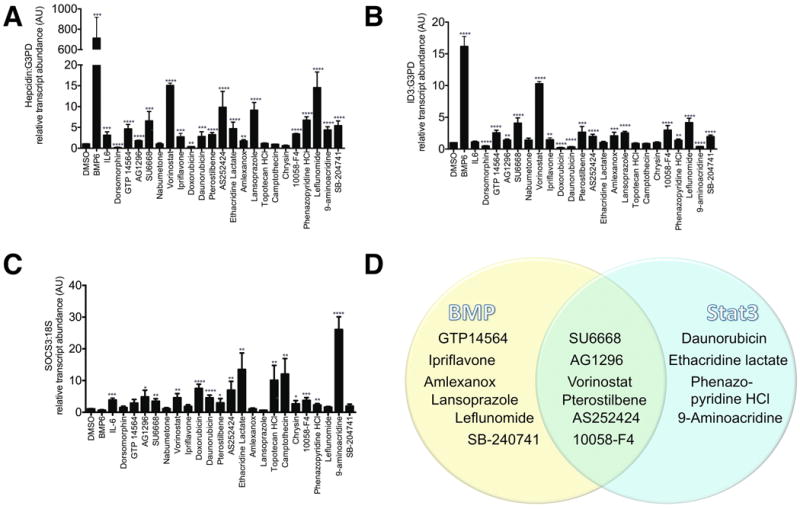
Quantitative realtime RT-PCR for A. Hepcidin, B. ID3, C. SOCS3. Following 8 hours of serum starvation in α-MEM/1%FBS, HepG2 cells were treated for 24 hours in α-MEM/1%FBS with DMSO 1%, BMP6 100 ng/ml, IL-6 100 ng/ml, dorsomorphin (an inhibitor of BMP signaling) 10 μM, GTP 14564 5 μM, AG1296 5 μM, SU6668 10 μM, nabumetone 5 μM, vorinostat 1 μM, ipriflavone 1 μM, doxorubicin 10 μM, daunorubicin 10 μM, pterostilbene 10 μM, AS252424 33 μM, ethacridine lactate 33 μM, amlexanox 33 μM, lansoprazole 33 μM, topotecan HCl 33 μM, camptothecin 33 μM, chrysin 33 μM, 10058-F4 33 μM, phenazopyridine 33 μM, leflunomide 33 μM, 9-aminoacridine 33 μM, SB-204741 33 μM. RNA was then extracted for quantitative realtime RT-PCR. Data shown are means±SE's. N=3-6 biological replicates per treatment. The global P-value generated using the Kruskal-Wallis test was <0.0001 for each experiment. Unpaired Student's t-tests were performed compared to DMSO alone. * denotes 0.009≤P<0.05, **denotes 0.0009≤P<0.009, ***denotes 0.0001≤P<0.0009, ****P<0.0001. D. Venn diagram illustrating which chemicals appear to increase RNA transcript levels of Hepcidin and the BMP-dependent transcript, ID3, and/or the Stat3-dependent transcript, SOCS3.