
Figure 3.
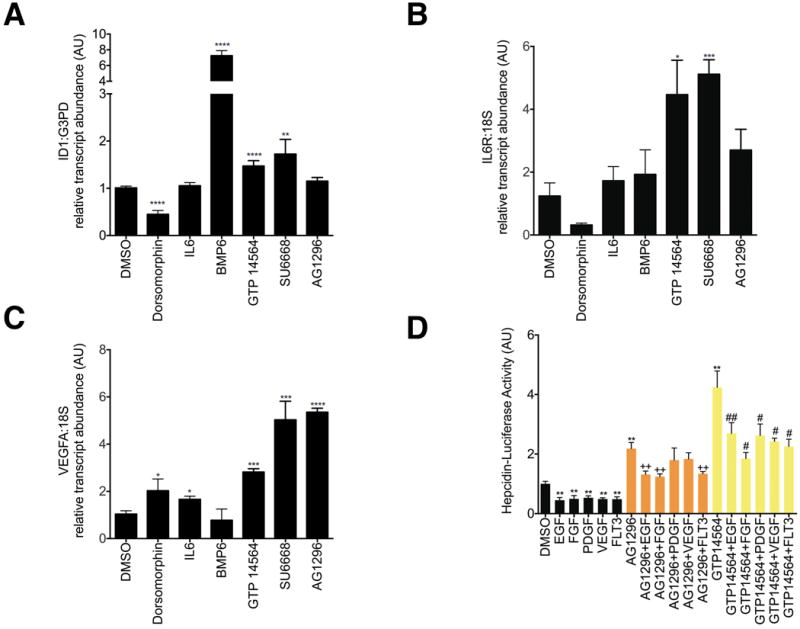
A-C. Effect of AG1296 and GTP 14564 on transcript levels of ID1(A), IL6 receptor (B), and VEGFA (C). HepG2 cells were treated with chemicals at the same doses and with the same conditions as described in Figure 2. Data shown are means±SE's. N=3-6 biological replicates per treatment. The global P-value generated using the Kruskal-Wallis test was <0.0001 for ID1 and =0.01 for IL6R and VEGFA. Unpaired Student's t-tests were performed compared to DMSO alone. * denotes 0.009≤P<0.05, **denotes 0.0009≤P<0.009, ***denotes 0.0001≤P<0.0009, ****P<0.0001. D. Effect of AG1296 or GTP 14564 on Hepcidin-Luciferase Activity in the presence or absence of growth factors or FLT3. After 16 hours of serum starvation in α-MEM/0% FBS, HepG2 cells stably transfected with Hepcidin-luciferase were treated for 24 hours with AG1296 (5 μM) or GTP 14564 (5 μM) in the presence or absence of EGF 150 ng/ml, FGF 200 ng/ml, PDGF 50 ng/ml, VEGF 150 ng/ml, or FLT3 150 ng/ml. Hepcidin-luciferase activity was measured using the OneGlo Assay (Promega) and is shown as mean fold-change over DMSO-treated control. The global P-value generated using the Kruskal-Wallis test was <0.0001. Unpaired Student's t-tests were performed. ** denotes 0.0009≤P<0.009, compared to DMSO-treated control. ++ denotes 0.0009≤P<0.009, compared to AG1296-treated cells. # denotes 0.009≤P<0.05, compared to GTP 14564-treated cells. ## denotes 0.0009≤P<0.009, compared to GTP 14564-treated cells. N=5-9 biological replicates for each condition.