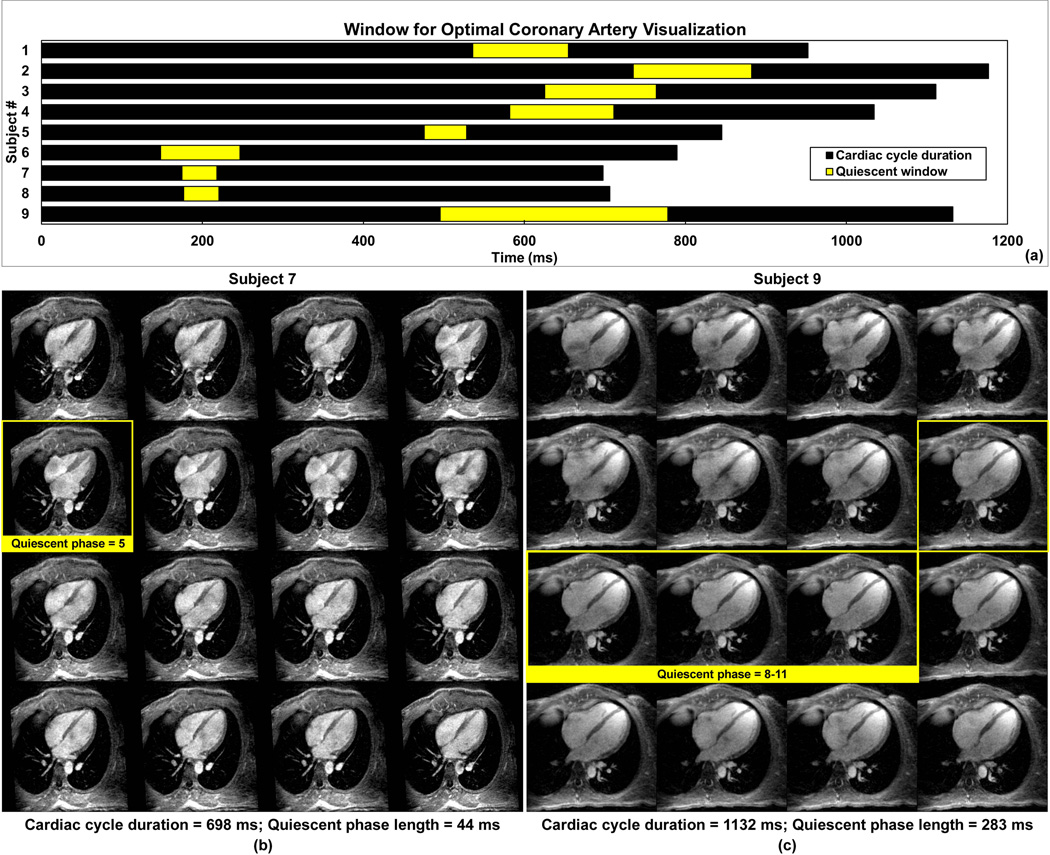
Figure 5.
The cardiac cycle durations (total length of the bars) and the quiescent periods (highlighted portions) of all 9 subjects are shown in (a). For subjects with higher heart rates (subject 6–8; 76–86 bpm), the peak-systole phase usually yields the least coronary motion, as opposed to the mid-diastole phase for the other subjects (subject 1–5, 9; 51–71 bpm). Shown in (b) are the 16 cardiac phases of subject 7 in four-chamber view reformatted from the 3D whole-heart volume. The window with the best coronary artery visualization contains phase 5. Shown in (c) are the 16 cardiac phases of subject 9 in four-chamber view reformatted from the 3D whole-heart volume. The window with the best coronary artery visualization contains phase 8–11.

