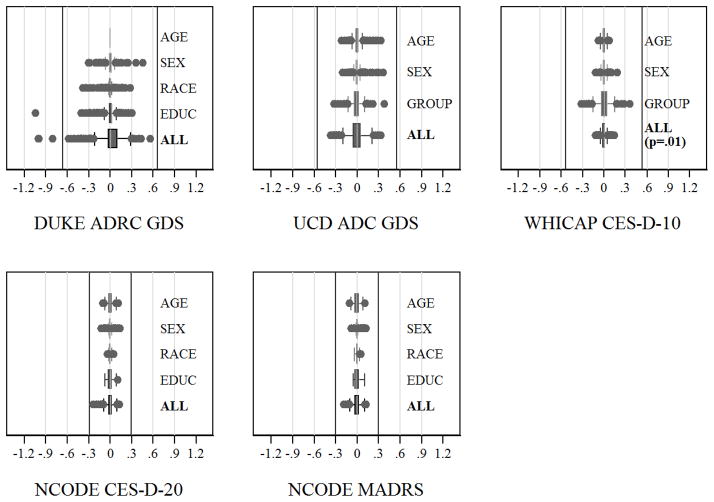
Figure 2.
Box plots of the changes in the IRT-based depression scores after accounting for DIF. The plots show the difference between unadjusted scores, and scores after accounting for DIF due to each individual demographic characteristic or overall DIF. If DIF had no impact for an individual, that observation should lie at zero. The grayed boxes represent the inter quartile range, whereas the whiskers signify the upper and lower adjacent values as defined by Tukey(Tukey, 1977). Observations more extreme than the upper and lower adjacent values are outliers, which are represented by dots. Vertical lines are placed at one Standard Error of Measurement for each scale in each sample, and indicate the presence of salient DIF. “Group” refers to the race/ethnicity-test language group in UCD ADC, and race/ethnicity-test language-years of education group in WHICAP (see Methods).

