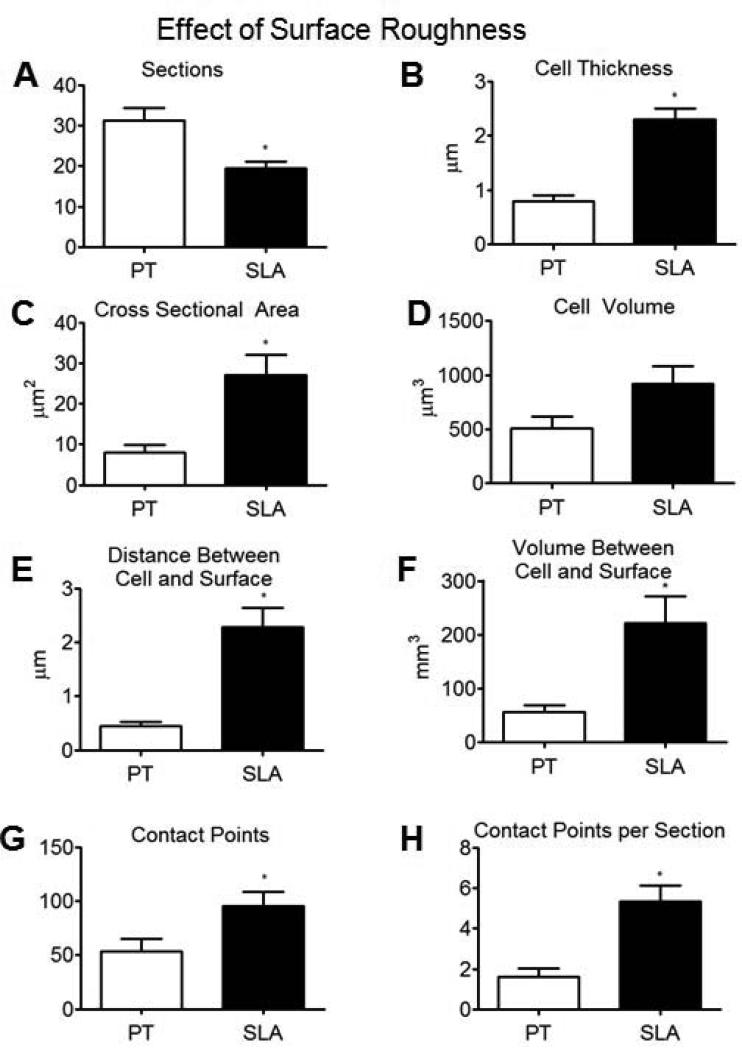
Figure 10.
Analyses of serial sectioned wild type MG63 cells grown on PT and SLA surfaces; number of cuts (A), mean cell thickness (B), mean cross sectional area (C), mean cell volume (D), mean distance between the cell and substrate surface (E), mean volume of space between the cell and substrate surface (F), number of apparent contact points (G), average number of apparent contact points (H), (n=6).*p < 0.05, WT on SLA vs WT on PT.

