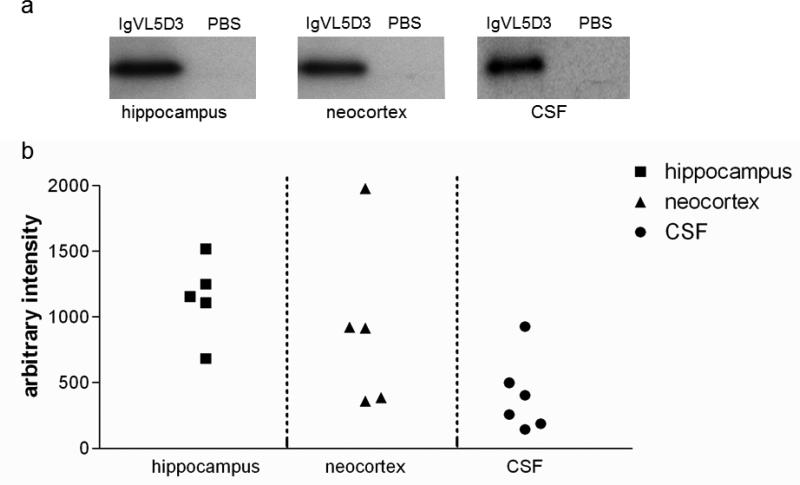
Fig 4. Levels of IgVL5D3 expression are high in the left hippocampus but vary in the neocortex.
Five months after rAAV9-IgVL5D3 injection, hippocampal and neocortex homogenates and CSF were prepared and subjected to 10– 20 % SDS PAGE followed by immunoblotting using anti-c-Myc antibody to determine expression levels of IgVL5D3. A mouse subjected to PBS injection was used as a negative control. Sixty μg of total protein for the homogenates and 10 μl of CSF were loaded on each lane. IgVL5D3 bands visualized by anti-c-Myc antibody are shown as a representative sample for hippocampus, neocortex, and CSF (a). The optical density of an IgVL5D3 band from each sample is plotted after normalization with the GAPDH band except CSF (b).

