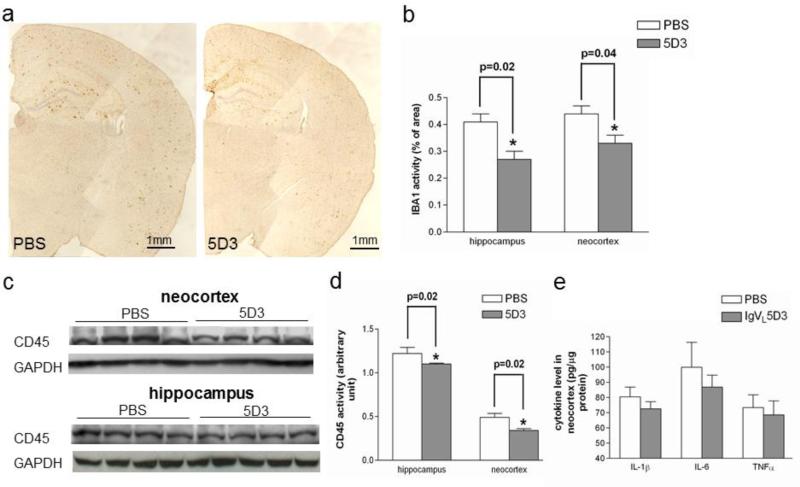
Fig 8. Therapeutic rAAV9-IgVL5D3 injection decreases microglia/monocyte activation.
Five months after rAAV9 or PBS injection, activated microglia and/or monocytes in the right hippocampus and neocortex were visualized by immunohistochemistry using anti-Iba1 antibody (a) and quantified by morphometric analysis. The percentages of Iba1-immunoreactive areas are shown as bar graphs (b). Homogenates of the left hippocampi and neocortices were subjected to SDS-PAGE followed by immunoblotting using anti-CD45 antibody (c). The bar graph represents the optical density ratio to that of the GAPDH band on the same lane (d). Pro-inflammatory cytokine levels in the left neocortex homogenates were determined by ELISA (e). The values shown are the mean ± SEM. Scale bars, 1 mm.

