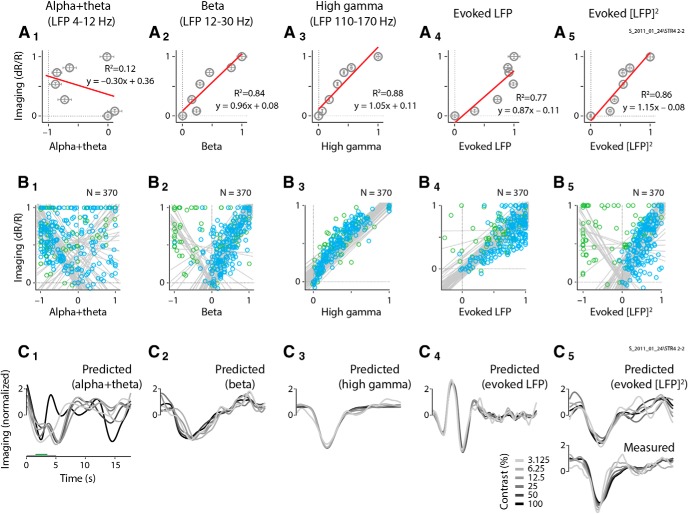
Figure 7.
Regressions of imaging versus LFP responses, and comparisons of predicted versus measured response shapes. Analyses and conventions are as in Figure 6, but for the LFP bands alpha + theta, beta, high gamma; evoked LFP; and evoked [LFP]2. A1–A5, Linear regressions for imaging versus the electrophysological responses, as labeled. Data points show the normalized mean response strengths for the same experiment as in Figure 6, calculated as in Figure 6, B1 and B2. B1–B5, Population scatter plots for imaging versus electrophysiological response strengths, as in Figure 6C, with regressions for individual experiments shown as gray lines. C1–C5, Shape comparison between measured and predicted imaging for the same experiment as in A1 and A2. Mean Pearson's r correlation values across contrasts, used to quantify shape similarity between measured and predicted imaging, are as follows: alpha + theta bands, 0.47; beta band, 0.73; high-gamma band, 0.93; evoked LFP, 0.32; evoked [LFP]2, 0.84.

