
Figure 2.
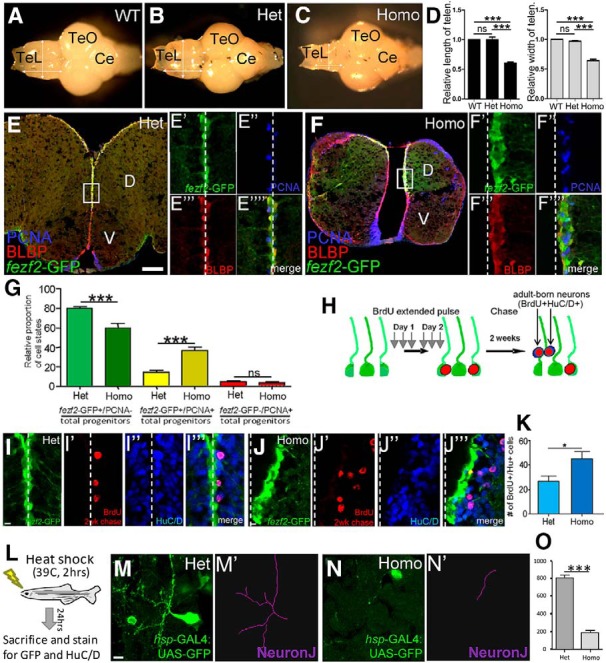
fezf2 is required for maintaining adult NSC quiescence and promoting the maturation of adult-born neurons. A–D, tof/fezf2 homozygous adult telencephalon is significantly smaller in size (C) compared with WT (A) and heterozygous (B) siblings, whereas the size of optic tectum (TeO) and cerebellum (Ce) is normal. D, Quantification of relative size of telencephalon compared with the rest of the brain (n = 6 brains for each genotype). Values are mean ± SEM. **p < 0.01 (one-way ANOVA followed by Tukey's Post Hoc Test). ***p < 0.001 (one-way ANOVA followed by Tukey's Post Hoc Test). E–E′′′′, Analysis of adult Tg[fezf2-GFP];fezf2+/m808 telencephalon with labeling for fezf2-GFP/BLBP/PCNA. Scale bar, 100 μm. F–F′′′′, Analysis of adult Tg[fezf2-GFP];fezf2m808/m808 telencephalon reveals a smaller telencephalon and often unaligned fezf2-expressing domains. Immunohistochemistry shows an increase in fezf2-GFP+/BLBP+ cells, as well as an increase in proliferation of these cells (PCNA+). G, Quantification of relative cell states shows a decrease of percentage quiescent fezf2-GFP+ cells and an increase of percentage proliferative fezf2-GFP+ cells in the mutant. No change in proliferation is observed for fezf2-GFP−PCNA+ (likely intermediate progenitor) cells (n = 3 heterozygous and 3 homozygous brains). Values are mean ± SEM. ***p < 0.001 (two-way ANOVA followed by Tukey's Post Hoc Test). H, A schematic diagram illustrating the experiment performed to assess adult neurogenesis. I–I‴, Labeling for fezf2-GFP, BrdU, and HuC/D shows adult-born neurons in the fezf2+/m808 DTel. Scale bar, 10 μm. J–J‴, Increase in adult-born neurons is observed in the fezf2m808/m808 DTel. K, Quantification shows a significant increase in adult neurogenesis in the fezf2m808/m808 DTel (n = 3 heterozygous and 3 homozygous brains). *p < 0.05 (Student's t test). Values are mean ± SEM. L–O, Analysis of neurite branching in individual DTel neurons with the NeuronJ program shows that the homozygous mutant neurons display a significant reduction in neurite extension per neuron. ***p < 0.001 (Student's t test). Values are mean ± SEM.