Figure 3.
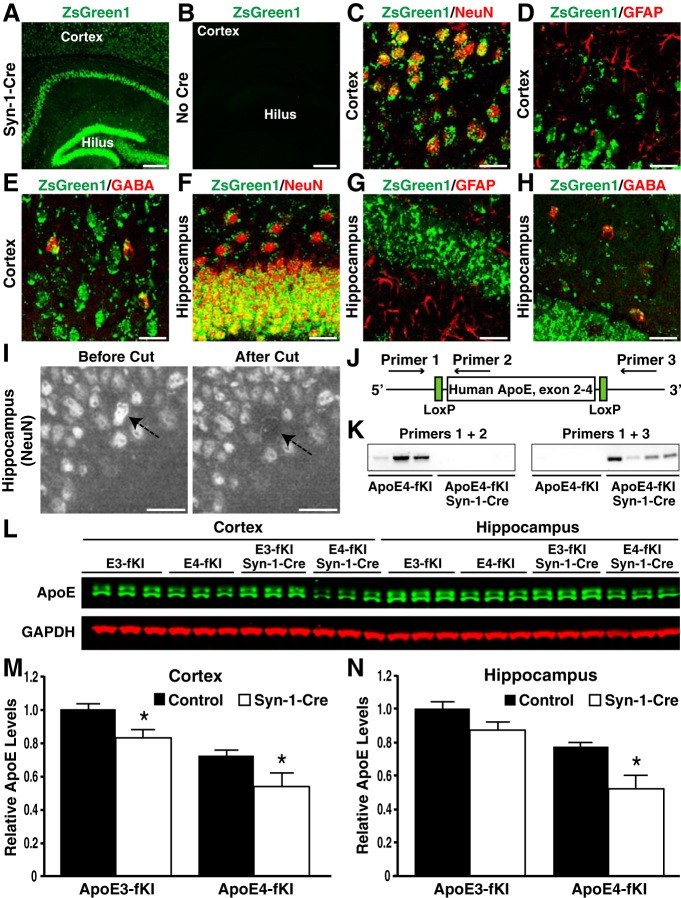
Generation and characterization of apoE-fKI/Syn-1-Cre mice. A, B, Expression of ZsGreen1 (green) in the cortex and hippocampus of Syn-1-Cre-positive (A) and -negative (B) ZsGreen1 reporter mice. Scale bars: 250 μm. C–H, ZsGreen1 was expressed in NeuN-positive neurons (C, F) and GABA-positive inhibitory interneurons (E, H), but not in GFAP-positive astrocytes (D, G) in the cortex and hippocampus of Syn-1-Cre-positive apoE-fKI mice. Scale bars: 30 μm. I, Images of the dentate granular cell layer before and after laser capture. Neuronal nuclei were identified by anti-NeuN immunostaining. Arrows indicate the cell before and after laser capture. Scale bars: 30 μm. J, Schematic of primers and their binding sites on the human APOE gene. K, PCR with primers 1 and 2 resulted in an amplified product in samples of apoE4-fKI mice, but not in samples of apoE4-fKI/Syn-1-Cre mice (left). PCR with primers 1 and 3 resulted in an amplified product in samples of apoE4-fKI/Syn-1-Cre mice, but not in samples of apoE4-fKI mice (right). Fifty nuclei per sample were used. L, Representative fluorescent Western blot of apoE (green) and GAPDH (red) in cortical and hippocampal lysates of 17-month-old female mice with different genotypes. M, N, Quantification of apoE protein levels relative to GAPDH protein levels in cortical (M) and hippocampal lysates (N) of 17-month-old mice (n = 5 per genotype). ApoE levels in apoE3-fKI mice were normalized to 1, and apoE levels in other groups of mice were presented relative to those in apoE3-fKI mice. *p < 0.05 (t test).

