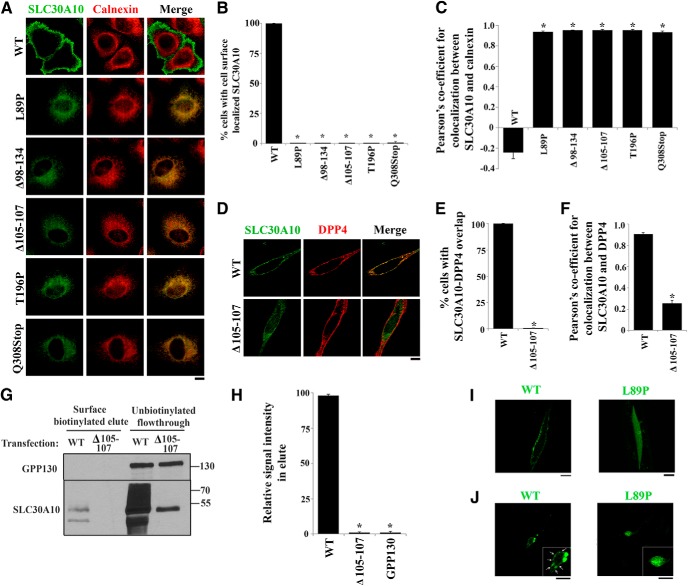
Figure 1.
Localization of SLC30A10–WT and disease-causing mutants in HeLa cells and C. elegans. A, HeLa cells were transfected with various FLAG-tagged SLC30A10 constructs. Two days after transfection, cultures were processed for immunofluorescence. SLC30A10 was detected using a monoclonal antibody against the FLAG epitope, and a polyclonal antibody against calnexin was used to demarcate the endoplasmic reticulum. Scale bar, 10 μm. B, Quantification of percentage cells with surface-localized SLC30A10 from A (mean ± SE; n = 3 experiments with >50 cells per experiment; *p < 0.05 for the difference between SLC30A10–WT and other mutants by one-way ANOVA, followed by Tukey–Kramer post hoc test). C, Quantification of the Pearson's coefficient for colocalization between SLC30A10 and calnexin from A (mean ± SE; n = 15–20 cells per SLC30A10 construct; *p < 0.05 for the difference between SLC30A10–WT and other mutants by one-way ANOVA, followed by Tukey–Kramer post hoc test). D, HeLa cells were cotransfected with FLAG-tagged SLC30A10–WT or SLC30A10–Δ105-107 and HA-tagged DPP4. Two days after transfection, SLC30A10 was detected using an antibody against FLAG and DPP4 with an antibody against HA. Scale bar, 10 μm. E, Quantification of percentage cells from D in which signals for SLC30A10 and DPP4 overlapped (mean ± SE; n = 3 experiments with >50 cells per experiment; *p < 0.05 for the difference between SLC30A10–WT and Δ105-107 by Student's t test). F, Quantification of the Pearson's coefficient for colocalization between SLC30A10 and DPP4 from D (mean ± SE; n = 17 cells per SLC30A10 construct; *p < 0.05 for the difference between SLC30A10–WT and the Δ105-107 mutant by Student's t test). G, HeLa cells were transfected with SLC30A10–WT or Δ105-107. Two days after transfection, cell surface proteins were biotinylated as described in Materials and Methods. For each transfection condition, 17% of the biotinylated elute and 10% of the unbiotinylated flow-through was loaded on a SDS-PAGE gel. Immunoblot assays were then performed to detect SLC30A10, using an anti-FLAG antibody, and GPP130. H, Quantification of the recovery of different proteins in the surface biotinylated elute from G. The signal intensity for SLC30A10–WT, SLC30A10–Δ105-107, and GPP130 in the surface biotinylated elute was calculated using NIH ImageJ. The sum of the signals was adjusted to 100, and the signal for each probe (SLC30A10–WT, SLC30A10–Δ105-107, or GPP130) was expressed as a percentage of the sum (mean ± SE; n = 3 experiments; *p < 0.05 for the difference between SLC30A10–WT and other probes by one-way ANOVA, followed by Tukey–Kramer post hoc test). I, GFP-tagged SLC30A10–WT or L89P were expressed in C. elegans under control of the unc-54 promoter. Body wall muscle cells were then imaged as described in Materials and Methods. Scale bar, 10 μm. J, GFP-tagged SLC30A10–WT or L89P were expressed in C. elegans under control of the dat-1 promoter. Localization of SLC30A10 in DAergic neurons was then assessed by microscopy. Arrowheads in the inset show surface localization of SLC30A10–WT. Scale bars: 10 μm; insets, 5 μm.

