Figure 2.
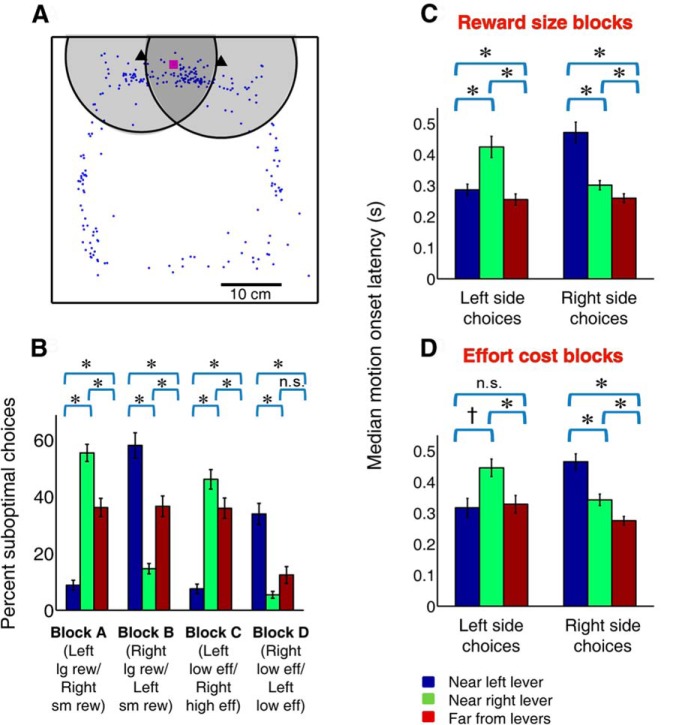
Rats exhibit impulsive responding at whichever lever is in close proximity. A, Distribution of a subject's head position at cue onset (blue dots) within the chamber during a single example session. Representation of the chamber is to scale. Scale bar, 10 cm. Black triangles represent positions of left and right lever. Magenta square represents location of reward receptacle. Shaded circles (radius 12.5 cm) represent the regions in which the subject was considered to be “near” one of the levers. In the overlapping shaded region, subjects were considered to be near the left lever when they were closer to the left lever than the right lever, and vice versa. B, Average percentage suboptimal choices (small reward or high effort) during each of the four blocks when rats were near the left lever (blue), near the right lever (green), or far from both levers (red) at cue onset. *p ≤ 0.001, †p ≤ 0.01 (corrected; Bonferroni post hoc test). n.s., Not significant. Suboptimal choices are most frequent when the rat is in close proximity to the suboptimal lever and least frequent when the rat is in close proximity to the optimal lever (associated with large reward or low effort). C, D, Average of median motion onset latencies in the three proximity conditions during reward size blocks (C) and effort blocks (D) for trials in which the rat was stationary at cue onset. Color conventions and symbols same as in B. A–D, Error bars indicate SEM. Trials in which the rat starts near the nonchosen lever (i.e., must overcome the propensity to choose a lever in close proximity) have the longest motion onset latencies.

