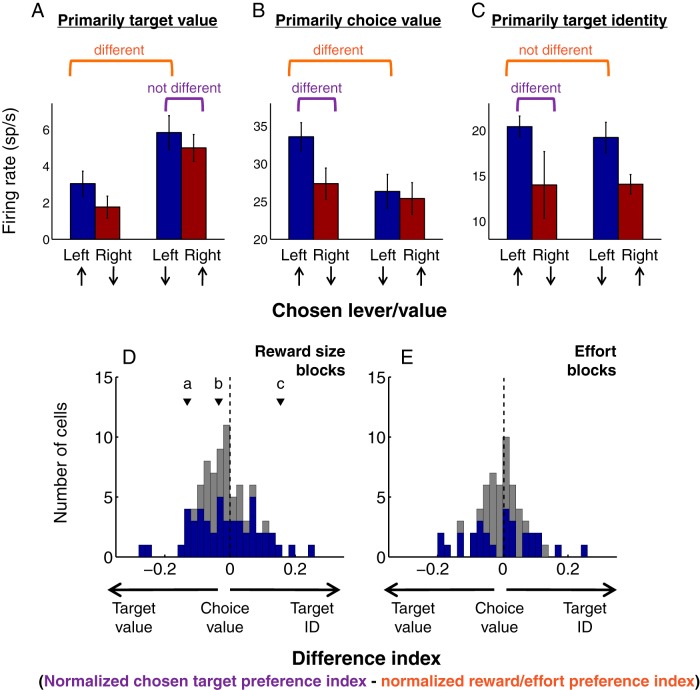
Figure 8.
Population-wide, cue-evoked excitations do not track the value of specific action targets. A–C, Response profiles of individual neurons encoding primarily target value (A), choice value (B), or target identity (C) during reward size blocks. Up arrows indicate choice associated with large reward; down arrows indicate small reward. Average firing rates are obtained from the 200 ms post-cue onset time window preceding each choice type. Error bars indicate SEM. Orange bracket indicates reward preference index comparison; purple bracket indicates chosen target preference index comparison. As in Figure 7, preference indices are calculated using ROC analysis; “different” indicates p < 0.1, permutation test. D, E, Distribution of a “difference index” representing the relative encoding of reward size associated with a choice versus reward size associated with a specific target (D) or effort cost associated with a choice versus effort cost associated with a specific target (E). Preference indices are normalized by subtracting 0.5 and taking the absolute value; the difference index is then calculated by subtracting the normalized reward/effort preference index from the normalized chosen target preference index. For each cue-excited neuron, the difference index is calculated with respect to the preferred target only (e.g., for the neuron represented in A, the left lever). Thus, a neuron that encodes target value would have a strongly negative difference index; a neuron that encodes target identity would have a strongly positive difference index; and a neuron that encodes choice value would have a difference index near zero. Arrowheads labeled “a,” “b,” and “c” indicate the difference index associated with the neurons shown in A–C, respectively. Blue represents the subset of neurons with at least one significant preference index (p < 0.1, permutation test). For both this subset and the population as a whole, the median difference index is not different from zero (p > 0.1, sign rank test), indicating a lack of consistent encoding of target value, choice value, or target identity on a population level.

