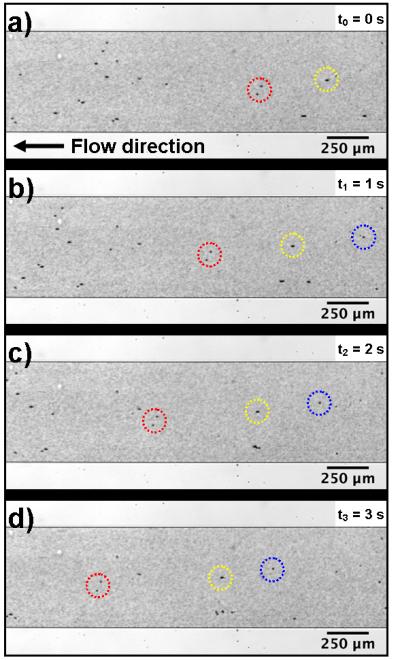
Fig. 3.

Experimental images showing the pumping behavior by indicating the movement of polystyrene beads at different time frames when (a) t0 = 0 s, (b) t1 = 1 s, (c) t2 = 2 s, and (d) t3 = 3 s. (Red, yellow, and blue circles indicate three representative groups of beads.)
