
Figure 4.
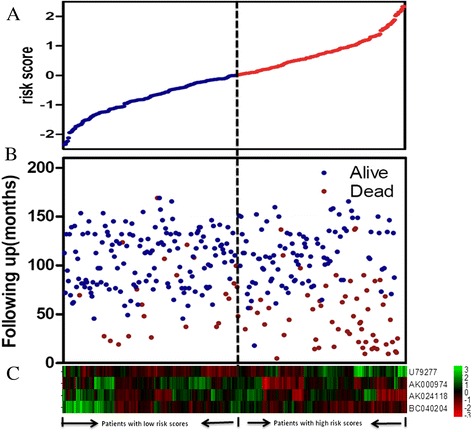
LncRNA risk score analysis of GEO patients. The distribution of four-lncRNA risk score, patients’ survival status and lncRNA expression signature were analyzed in the training set patients (n = 327). (A) LncRNA risk score distribution; (B) patients’ overall survival status and time; (C) heatmap of the lncRNA expression profiles. Rows represent lncRNAs, and columns represent patients. The black dotted line represents the median lncRNA risk score cutoff dividing patients into low-risk and high-risk groups.