Figure 2.

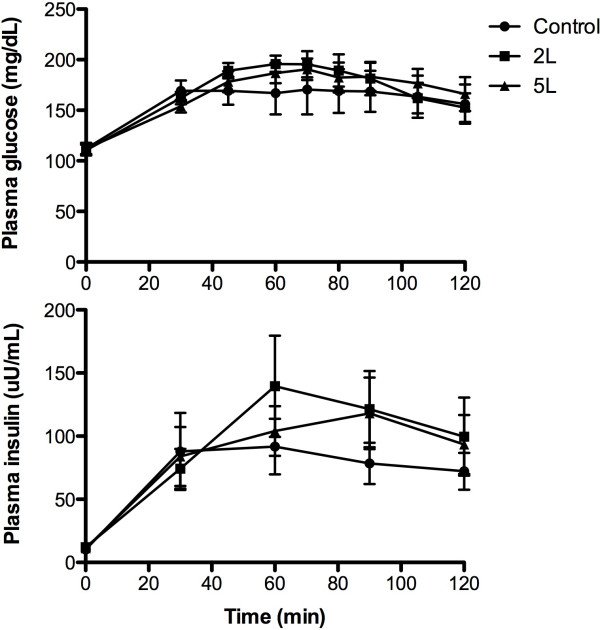
Plasma concentrations of glucose and insulin during the OGTT-DT in the control, 2 grams lysine, and 5 grams of lysine. Data are mean ± SEM. Significant increase over time for all three groups (P < 0.05).

Plasma concentrations of glucose and insulin during the OGTT-DT in the control, 2 grams lysine, and 5 grams of lysine. Data are mean ± SEM. Significant increase over time for all three groups (P < 0.05).