
Figure 6.
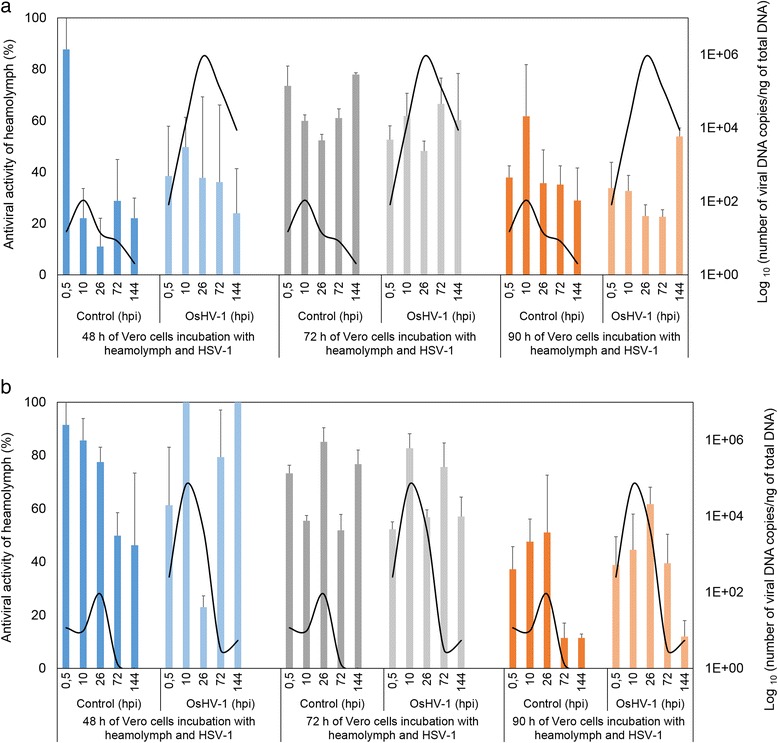
Antiviral activity kinetic of adult oyster haemolymph stimulated or not stimulated with OsHV-1 for family A1 (a) and family A2 (b) at different times in relation to HSV-1 infection of Vero cells. Blue bars, 48 h of Vero cell incubation with heamolymph and HSV-1 virus; Grey bars, 72 h of Vero cell incubation with heamolymph and HSV-1 virus and orange bars, 90 h of Vero cell incubation with heamolymph and HSV-1 virus. The viral DNA quantification is presented by black curves.