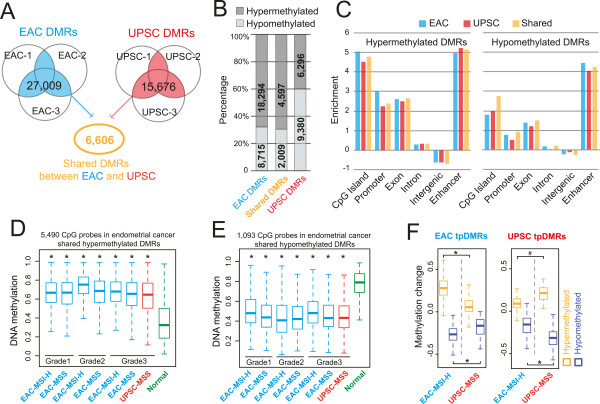
Figure 1.

Identification, annotation, and validation of DMRs in endometrioid adenocarcinoma (EAC) and uterine papillary serous carcinoma (UPSC). (A) 27,009 DMRs were identified in at least 2 EAC samples (blue: EAC-DMRs), 15,676 DMRs were identified in at least 2 UPSC samples (red: UPSC-DMRs). 6,606 DMRs were identified in both EAC and UPSC as endometrial cancer (EC) shared DMRs (orange: EC-shared DMRs). (B) Percentage of hypermethylated (dark gray) and hypomethylated (light gray) EAC-, UPSC-, and EC-shared DMRs. (C) Genomic feature enrichment for hypermethylated DMRs (left) and hypomethylated DMRs (right). (D) The DNA methylation level of 5,490 CpGs located within 2,454 hypermethylated EC-shared DMRs in pre-classified (grade, microsatellite state, and subtype) endometrial cancer samples (blue: EAC; red: UPSC) and normal controls (green) in TCGA Infinium 450K data. DNA methylation level of each CpG site was averaged within the pre-classified group. Each boxplot represents the distribution of averaged methylation levels of 5,490 CpGs in cancer and controls. MSI-H: Microsatellite instability-high. MSS: Microsatellite stable. Asterisk: P < 1e-21 (Mann–Whitney U test). (E) The DNA methylation level of 1,093 CpGs located within 576 hypomethylated EC-shared DMRs in the same cohort (blue: EAC; red: UPSC) and controls (green) as in (D). Asterisk: P < 1e-21 (Mann–Whitney U test). (F) Validation of EAC and UPSC type-preferred DMRs (tpDMRs) by TCGA Infinium 450K data. Left: DNA methylation change of 2,002 EAC tpDMRs in grade 3 MSI-H-EAC (blue) and MSS-UPSC (red), compared to normal controls. Right: DNA methylation change of 147 UPSC tpDMRs in same samples of UPSC (red) and EAC (blue). DNA methylation changes were calculated by subtracting the averaged methylation level of the normal controls from the methylation level of each DMR in each cancer sample. Asterisk: P < 1e-21, octothorpe: P <1e-3 (Mann–Whitney U test).
