Figure 2.

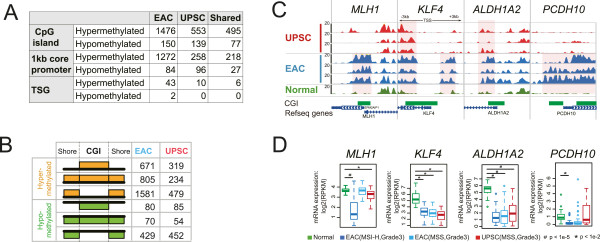
Methylation changes at CpG islands and promoters. (A) Numbers of CpG islands, 1 kb core promoter of RefSeq genes, and promoters of tumor suppressor genes (TSG) with hypermethylated and hypomethylated alterations in EAC and UPSC. (B) Classification of DNA methylation patterns in CpG islands and their shore regions: hypermethylation (orange) and hypomethylation (green) at CGI-only, both CGI and shores, and shores-only. (C) Epigenome Browser views of four tumor suppressor gene (TSG) promoters with different DNA methylation patterns across seven samples. MeDIP-seq tracks were displayed. The gene set view (-3 kb to +3 kb regions around TSS) was produced using the WashU Epigenome Browser. Increased methylation level was highlighted by pink shading. (D) Gene expression analysis of the same four TSG in (C) with hypermethylated promoters in normal controls and grade 3 pre-classified (microsatellite stability, subtype) endometrial cancers. Y-axis: RPKM value based on mRNA-seq from TCGA. Asterisk indicates P <0.01, octothorpe indicates P <1e-5, Student’s t-Test.
