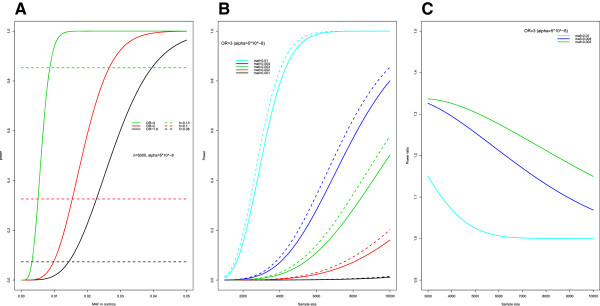
Figure 2.

Relationship between power and needed sample size based on OR and Cohen’s h for rare SNPs. (A) Line plot shows the power estimated by OR (bold line) and Cohen’s h (dotted line) at the same threshold. (B) power curves given fixed OR =3 with corresponding Cohen’s h at varying MAF in controls. (C) Power ratio at varying MAF in controls and varying sample size.
