
Figure 3.
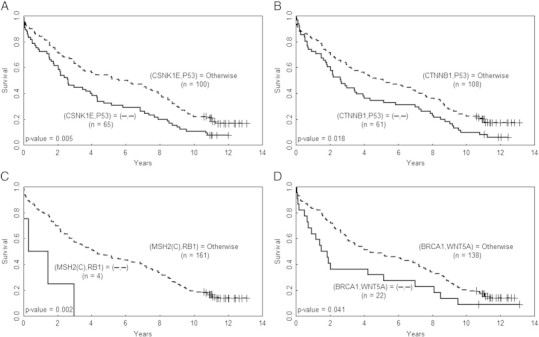
Abnormal IHCs of the four protein pairs are correlated with poor prognosis Kaplan-Meier survival curves of CRC patients divided by the paired IHCs of (A) CSNK1E and P53, (B) CTNNB1and P53, (C) MSH2(C) and RB1, and (D) BRCA1 and WNT5A. The curves for the patients with paired abnormal IHCs are plotted in solid line and the curves of the remaining patients are plotted in dashed line; the symbol “-” denotes abnormal IHC of the corresponding protein.