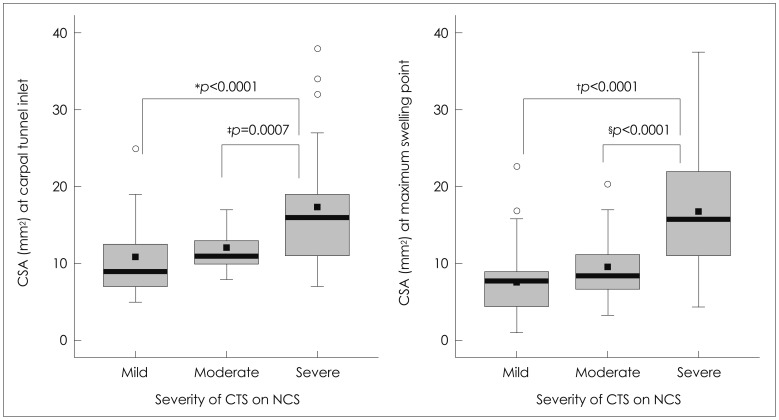
Fig. 3.
Box plot showing the median nerve CSAs measured using 3D ultrasonography at the carpal tunnel inlet (left) and the maximal swelling point (right) in patients with CTS who were stratified according to the severity of their condition based on EDX (NCS). A gradual increase in CSA was observed with worsening CTS severity, with significant differences being apparent at both nerve sites between the severe- and mild-CTS groups (*p<0.0001 at the carpal tunnel inlet; †p<0.0001 at the maximum swelling point) and between the severe- and moderate-CTS groups (‡p=0.0007 at the carpal tunnel inlet; §p<0.0001 at the maximum swelling point). Bold black lines indicate medians and whiskers indicate error bars; ○, outliers; ■, mean values (10.5±4.6, 11.6±2.6, and 17.1±7.5 mm2 in the mild-, moderate-, and severe-CTS groups, respectively, at the carpal tunnel inlet; and 11.7±4.7, 13.0±3.4, and 19.7±7.2 mm2, respectively, at the maximum swelling point). CSAs: cross-sectional areas, CTS: carpal tunnel syndrome, EDX: electrodiagnostic, NCS: nerve conduction study.

