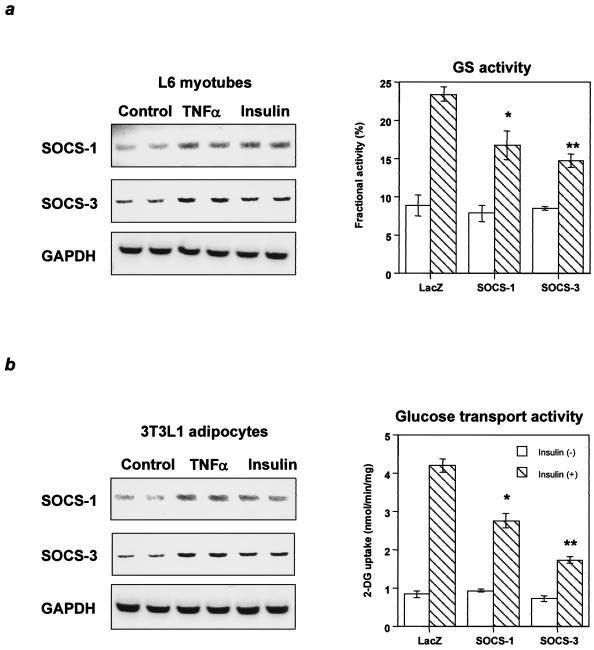
FIG. 6.
Inhibitory effects of SOCS-1 and SOCS-3 on biological responses to insulin in muscle cells and adipocytes. (a) Increased SOCS-1 or SOCS-3 inhibits glycogen synthase activity in L6 myotubes. (b) Increased SOCS-1 or SOCS-3 inhibits glucose transport activity in 3T3L1 adipocytes. The left panels show representative results of RT-PCR using RNA with the indicated treatment, and in the right graphs each bar represents the means ± standard errors (n = 4). *, P < 0.05 for LacZ versus SOCS-1; **, P < 0.05 for LacZ versus SOCS-3 adenovirus treatment.

