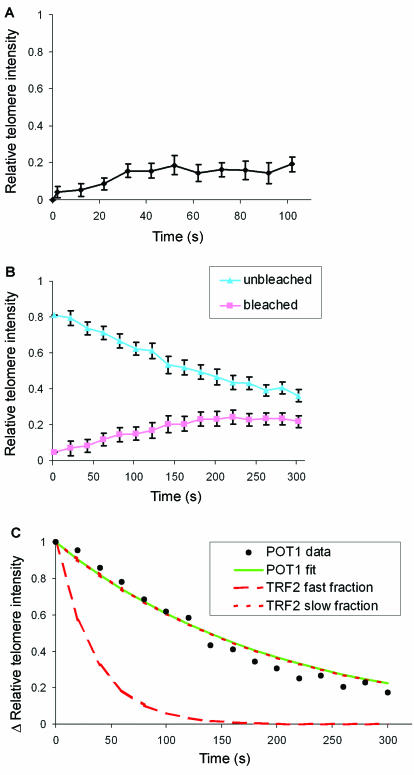
FIG. 5.
Analysis of FRAP and FLIP-FRAP experiments of telomere-bound GFP-POT1. (A) Quantitative analysis of the redistribution of GFP-POT1 at individual bleached telomeres in living HeLa cells by using FRAP; (B) quantitative analysis of redistribution of GFP-POT1 at telomeres separately in the bleached and unbleached region of the nucleus of living HeLa cells by using FLIP-FRAP. Values are means ± the SEM from at least 40 cells. (C) Fitting analysis of experimental data from panel B to the equation ΔIrel(t) = f1e−k1t + f2e−k2t indicates single binding kinetics of GFP-POT1. Note the similarity between the fitted curves of POT1 (green line) and the slow fraction of TRF2 (dotted red line). The percentages of fractions and association constants are summarized in Table 1.

