Figure 1.
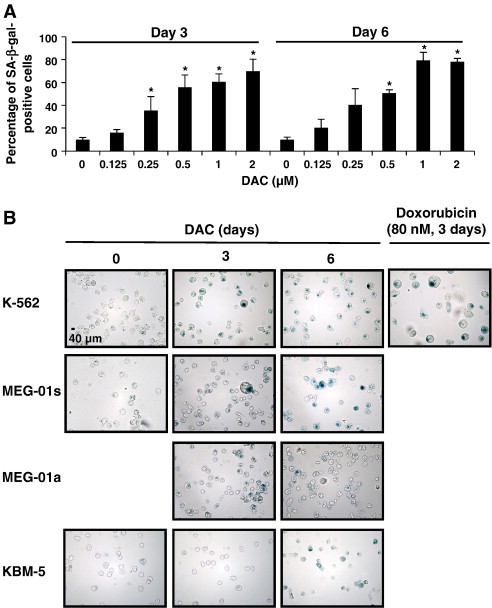
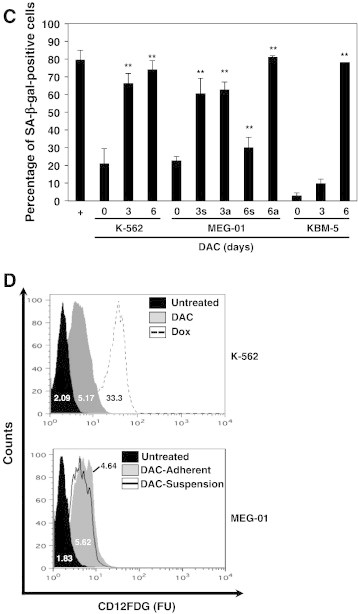
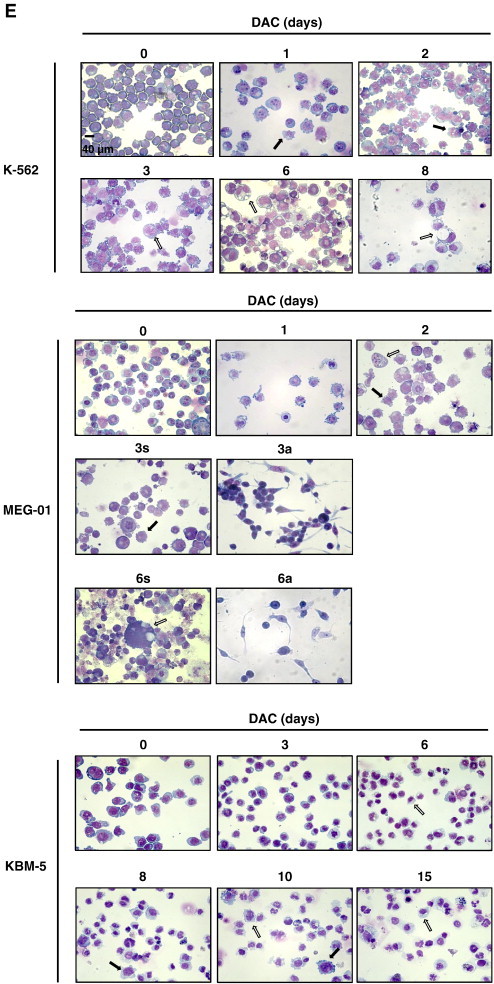
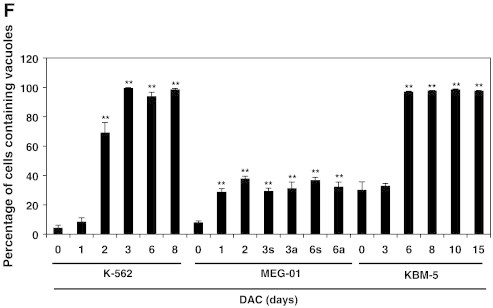
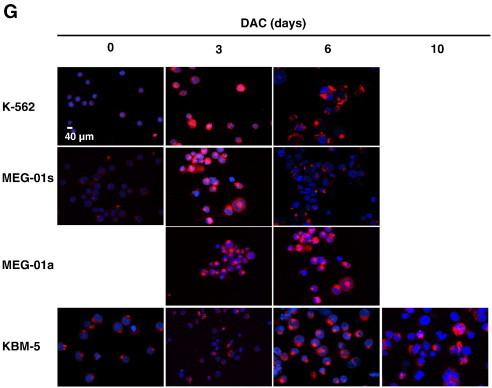
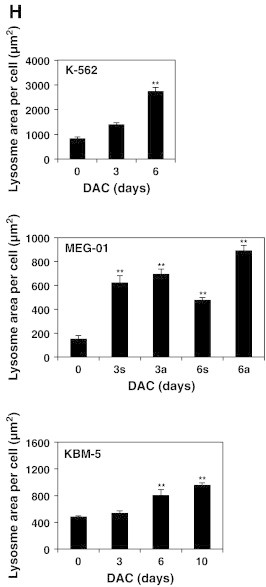
DAC elicits senescence in CML cells.
(A) DAC increases SA-ß-gal activity in K-562 cells. Data are the mean (±SD) of 3 independent experiments. * P < 0.05, ** P < 0.01 versus control (two-way ANOVA). (B to H) K-562, MEG-01 and KBM-5 cells were cultured in presence or absence of 2 μM DAC for the indicated period of time. “a” and “s” refer to adherent and suspension MEG-01 populations, respectively. (B) Cytochemical detection of SA-ß-gal activity. (C) Percentage of SA-β-gal-positive cells. The positive control (+) corresponds to K-562 cells treated with 80 nM doxorubicin for 72 hours. (D) Flow cytometry determination of SA-ß-gal. Numbers represent mean fluorescence intensity. (E) Morphological analysis. White arrows indicate vacuoles and black arrows indicate bulbous protrusions. (F) Number of cells exhibiting vacuoles as a percentage of the total cell population. (G) Analysis of lysomal mass with pictures representing the merged signal of LysoTracker Red (lysosomes) and Hoechst (nuclei). (H) Lysosomal mass area quantification. Results represent the mean ± SD of three independent experiments. All pictures are representative of three independent experiments. * P < 0.05, ** P < 0.01 versus control (one-way ANOVA).
